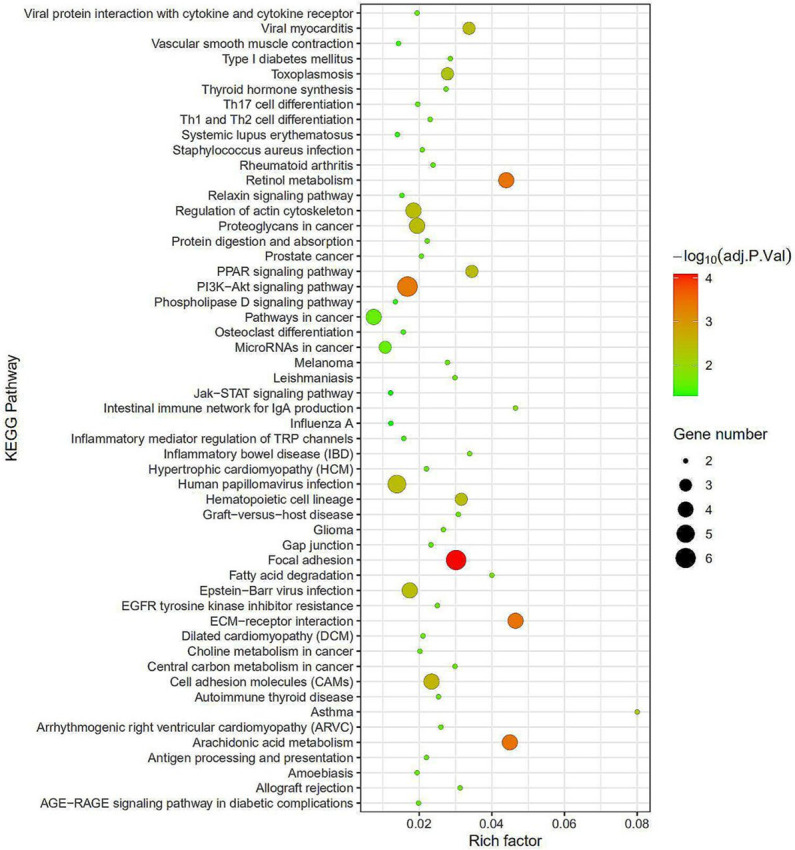
Figure 2.

KEGG pathways enrichment analysis. The redder the bubble color indicates a smaller the P value, the larger the bubble indicates a greater the number of genes. It can be seen from the figure that the bubble on Focal adhesion is the largest, and the color is the reddest, which implies the best enrichment effect.
