Figure 7.
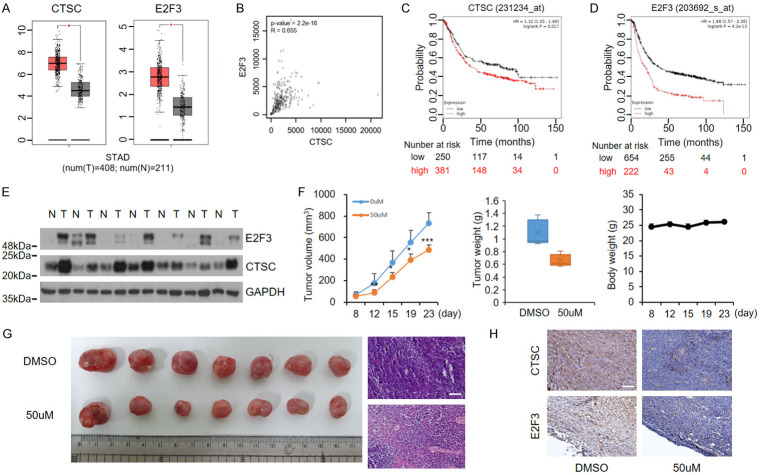
Cathepsin C and E2F3 are upregulated and correlated with aggressiveness in GC. A. CTSC and E2F3 are highly expressed in GC tumors (GEPIA: http://gepia.cancer-pku.cn/). B. Correlation analysis of CTSC and E2F3 expression levels in GC. C, D. Survival analysis by Kaplan-Meier plot. Survival is lower in patients with high expression of CTSC and E2F3 than in patients with low expression of CTSC and E2F3. E. CTSC and E2F3 expression levels in tissues from patients with GC. Western blotting of protein expression levels in GC tumor and matched adjacent non-tumor tissues. Full-length blots are presented in Supplementary Figure 6. F. NCI-N87 cells were subcutaneously injected into nude mice. Tumor growth, tumor weight, and body weight were measured twice per week. Tumor volume was calculated as follows: (length × width2)/2. G. Dissected tumor tissues from BALB/c-nude mice. Tumors derived from decursin-injected mice were smaller than tumors derived from control mice. Representative hematoxylin and eosin staining indicated tumor histology (×200). Scale bar: 100 μm. H. Representative immunohistochemistry staining of CTSC and E2F3. N, non-tumor tissue; T, tumor tissue (×200). Scale bar: 100 μm.

