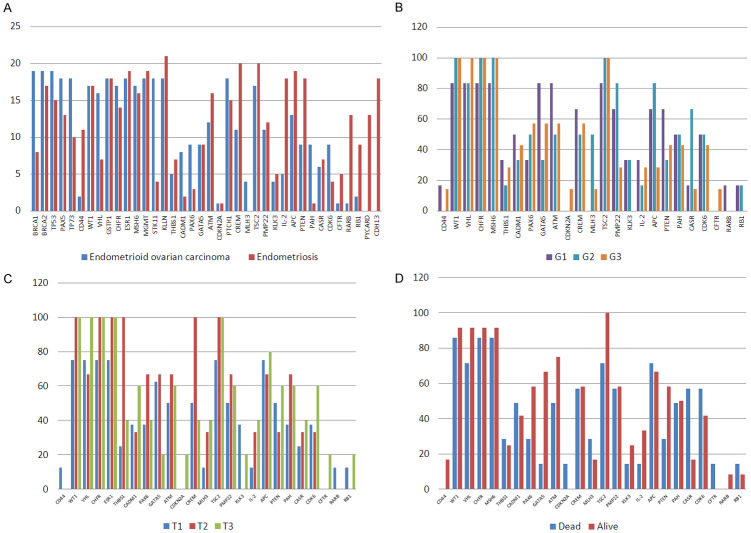
Figure 3.
Bar graph comparing the (A) No of methylated endometrioid ovarian cancer (19) and endometriosis samples (21). Bar graph comparing the percent frequency of methylation of the 20 selected genes with (B) tumor differentiation grade (C) tumor stage; (D) Bar graph comparing the percent frequency of methylation of the 20 selected genes pre- and post-mortem, exhibited in the ovarian endometrioid carcinoma patients (n=19).

