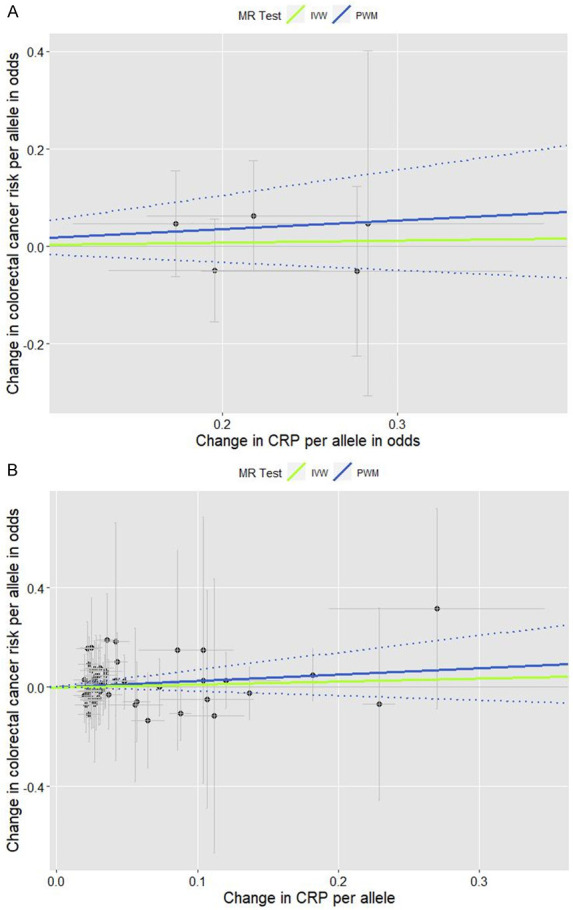
Figure 1.

Scatter plots for the effects of individual CRP-genetic instrumental variables on colorectal cancer risk. Each black dot reflects a genome-wide CRP-raising genetic variant. The blue lines indicate penalized weighted median estimates and 95% CIs. (CI, confidence interval; CRP, C-reactive protein; HR, hazard ratio; IVW, inverse-variance weighted; MR, Mendelian randomization; PWM, penalized weighted median; SNP, single-nucleotide polymorphism). A. Five genome-wide SNPs associated with high immune response and chronic inflammation (CRP > 3.0 mg/L) (PWM HR2nd-stage = 1.20, 95% CI: 0.85-1.68; MR-Egger intercept p value = 0.673). B. Fifty-six genome-wide SNPs associated with CRP phenotype that was naturally log-transformed (mg/L) (PWM HR2nd-stage = 1.29, 95% CI: 0.83-1.99; MR-Egger intercept p value = 0.824).
