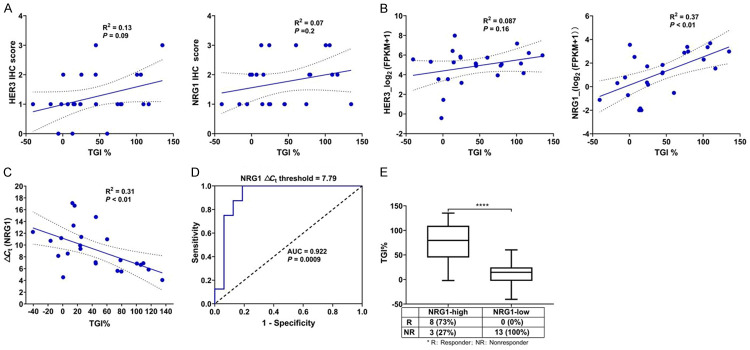
Figure 3.
Correlation between HER3 and NRG1 expression and the efficacy of CAN017 in 24 PDX models in cohort 1. A. Pearson correlation plots of the HER3 and NRG1 protein expressions evaluated by IHC in FFPE tumors and the efficacy of CAN017 in PDX models (n = 24). The linear regression was shown by a solid line, and 95% confidence interval (CI) of the values fitted by linear regression was shown by dark dotted lines. R2, the coefficient of determination. B. Pearson correlation plots of the HER3 and NRG1 mRNA expression quantified by RNAseq in tumors and the efficacy of CAN017 in PDX models (n = 24). The linear regression was shown by a solid line, and 95% CI of the values fitted by linear regression was shown by dark dotted lines. C. Pearson correlation plots of the NRG1 mRNA expression quantified by RT-PCR in FFPE tumors and the efficacy of CAN017 in PDX models (n = 24). The linear regression was shown by a solid line, and 95% CI of the values fitted by linear regression was shown by dark dotted lines. D. ROC curve analysis for the NRG1 ΔCt threshold to predict the response of CAN017. AUC, area under curve. E. Comparison of the efficacy of CAN017 between NRG1-high and NRG1-low PDX models. ****P < 0.0001 analyzed by unpaired two-tailed t test.

