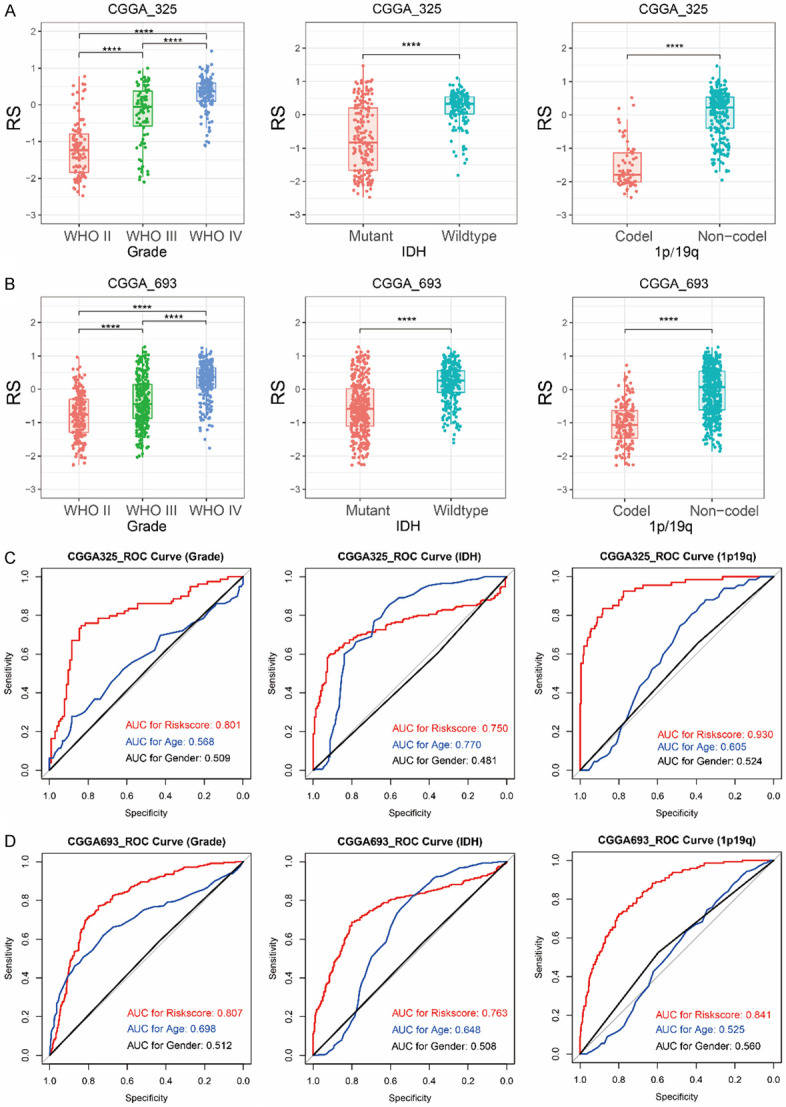
Figure 4.

Association between risk score (RS) and pathological characteristics (Grade, IDH mutation and 1p/19q codeletion). Differences in the distribution of risk score (RS) among patients with different pathological characteristics in CGGA_325 dataset (A) and CGGA_693 dataset (B). ROC curves revealed the predictive value of risk score, age and gender for pathological characteristics (Grade, IDH mutation and 1p/19q codeletion) in CGGA_325 dataset (C) and CGGA_693 dataset (D). ****P < 0.0001.
