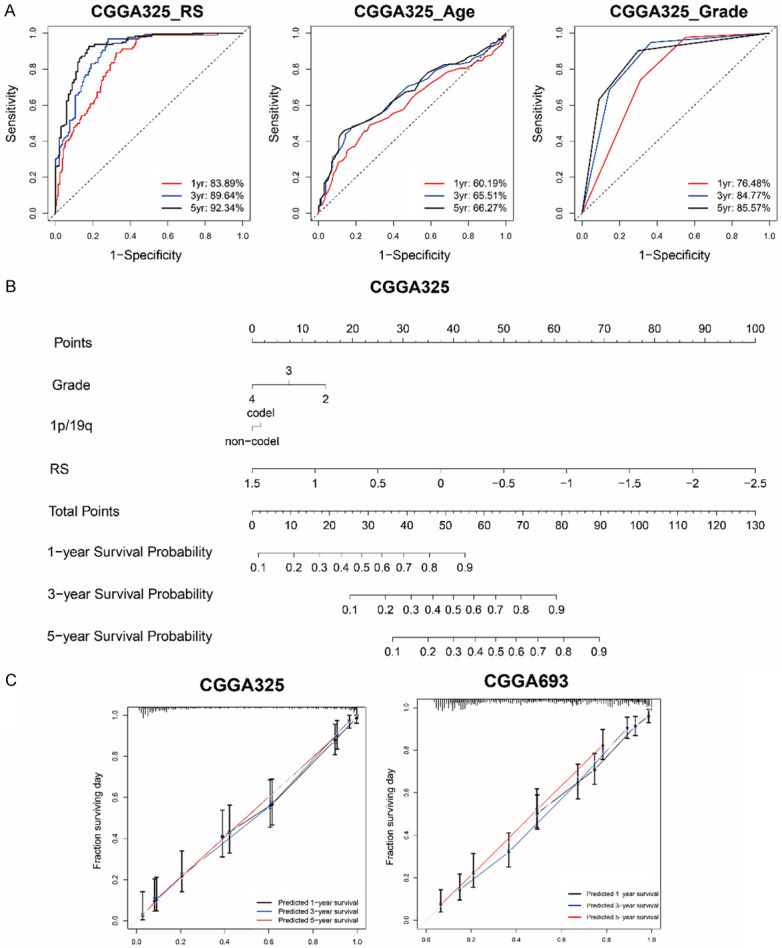
Figure 6.

A survival prediction model for glioma patients based on recurrence-related signature. A. 1-year, 3-year and 5-year ROC curves indicated the sensitivity and specificity of signature risk score, age and grade in CGGA_325 dataset. B. A nomogram prediction model was developed by integrating the signature RS with the pathologic features in the CGGA_325 dataset. C. Calibration curves of nomogram for predicting overall survival at 1-year (black line), 3-year (blue line) and 5-year (red line) in the CGGA_325 and CGGA_693 dataset.
