
Figure 5.
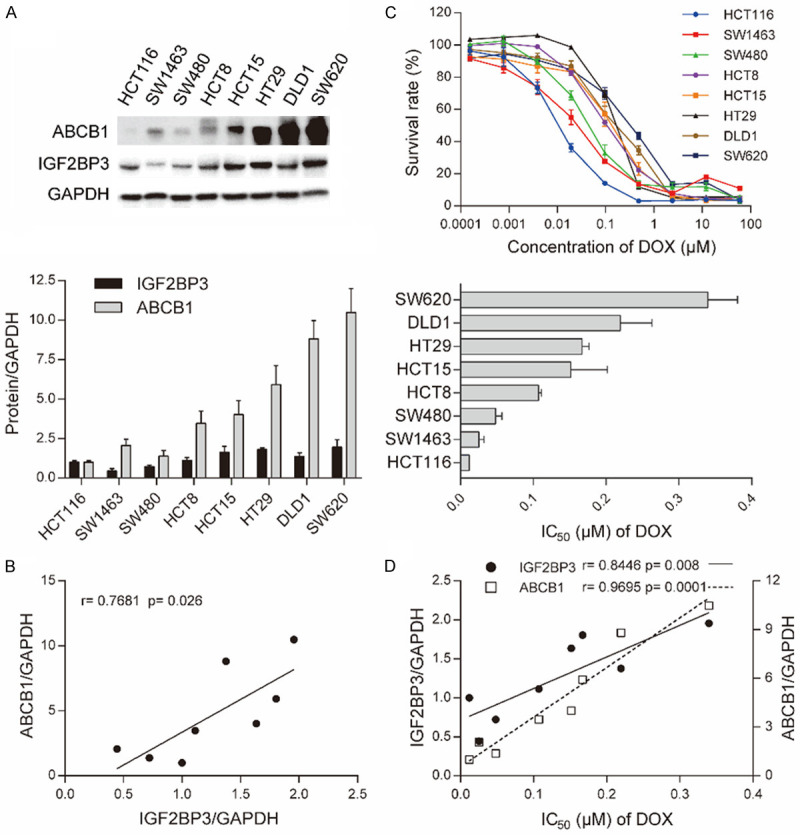
ABCB1 expression and DOX sensitivity was positively associated with IGF2BP3 in CRC cell lines. A. Western blotting analysis showing protein expression of ABCB1 and IGF2BP3 in 8 kinds of CRC cell lines (upper) and quantitative analysis of densitometry values as determined using Image J (lower). The relative expression of protein/GAPDH was normalized by HCT116 cells. B. Pearson correlation analysis showing the association between ABCB1 and IGF2BP3 expression in CRC cell lines. C. Cell survival curves for CRC cell lines treated with DOX for 72 h (upper) and IC50 values plotted (lower). D. Pearson correlation analysis showing the association of ABCB1 and IGF2BP3 expression with IC50 values of DOX. Data are shown as mean ± SD of n = 3 independent assays. *, P <0.05; **, P <0.01, ***, P < 0.001 (Pearson correlation).