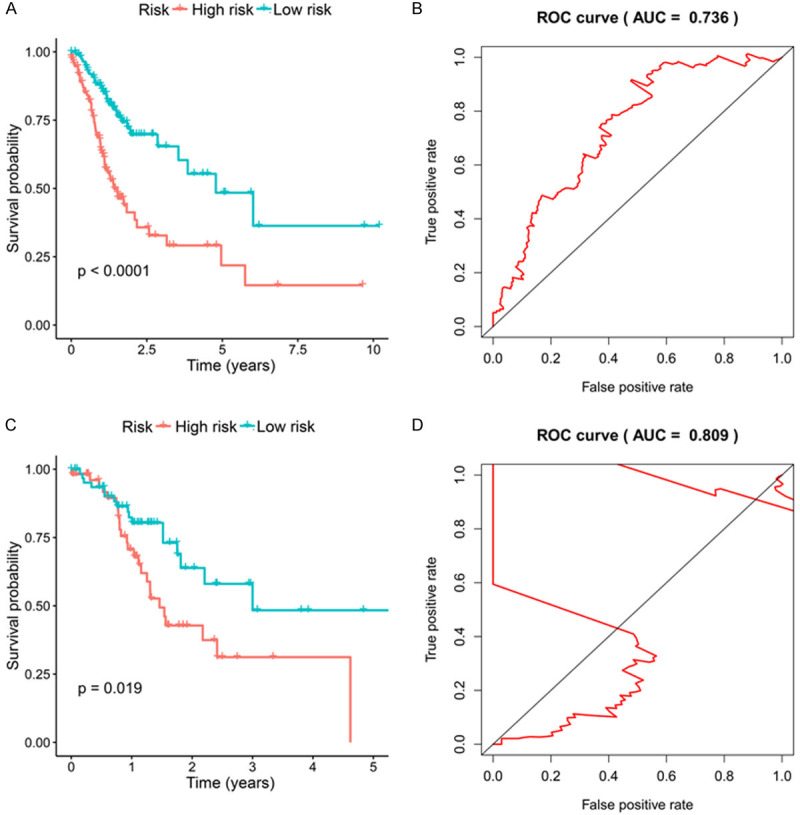
Figure 4.

A. K-M curve of the high-risk (red) and low-risk (green) GC patients in the training group. B. The 5-year ROC curves in the training group of GC patients. C. K-M curve of the high-risk (red) and low-risk (green) GC patients in the testing group. D. The 5-year ROC curves in the testing group of GC patients.
