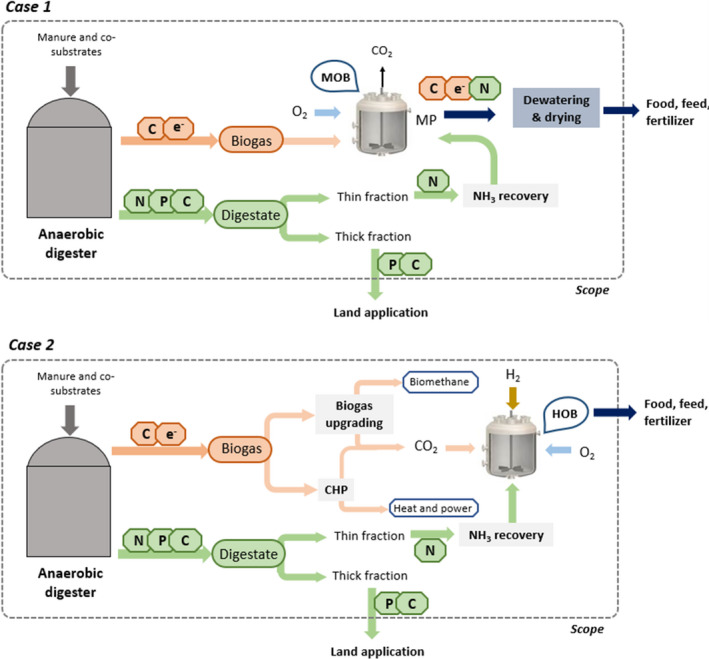
Fig. 1.

Schematic representation of the two microbial protein production approaches in an anaerobic digestion context. The coloured arrows represent the flows of carbon (C), nitrogen (N), phosphorus (P) and energy (e‐) between the different unit technologies (anaerobic digestion, biogas upgrading, biogas combustion in a combined heat and power unit, and microbial protein via methane‐oxidizing and hydrogen‐oxidizing bacteria).
