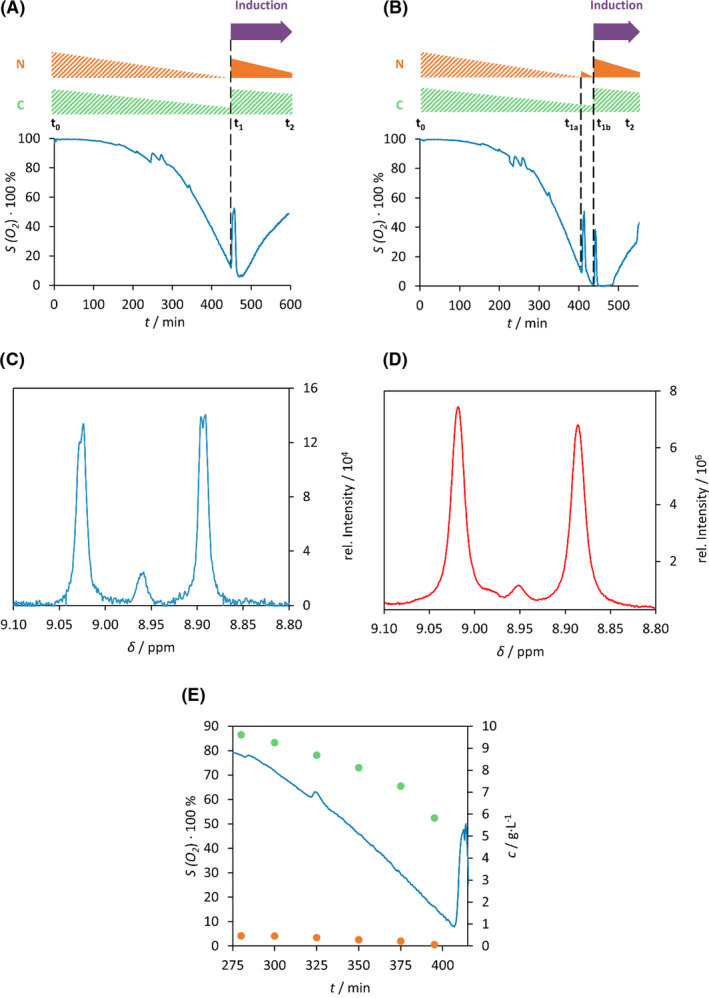
Fig. 1.

Comparison of the two batch‐fed strategy. (A) During isotope labelled expression using one‐step and (B) two‐step feeding scheme, the dissolved oxygen (%) was monitored as function of the time. The relative consumption of D‐Glc (green triangle) and NH4Cl (orange triangle) are depicted schematically above using solid colours for 13C‐ or 15N‐, while striped colours for natural abundant (12C‐ or 14N‐) ingredients. Purple arrow points to the time of induction. t 0: beginning of fermentation; t 1, time of feeding; t 1a, t 1b, time of the first or second feeding; t 2, end of the fermentation. Selected 1H‐NMR signals of backbone amid H(N) of Glu3 of 15N‐labelled E5: using either (C) the one‐step (red line) or (D) two‐step feeding (blue line) fermentation protocol. The doublet stands for the 1H‐15N one‐bond coupling non‐existent in a 1H‐14N system resulting in a singlet. (E) Monitoring both D‐Glc (green dot) and NH4Cl (orange dot) concentration (g·l−1) changes with variation of the dissolved oxygen (%) (blue line) as function of the fermentation time (min).
