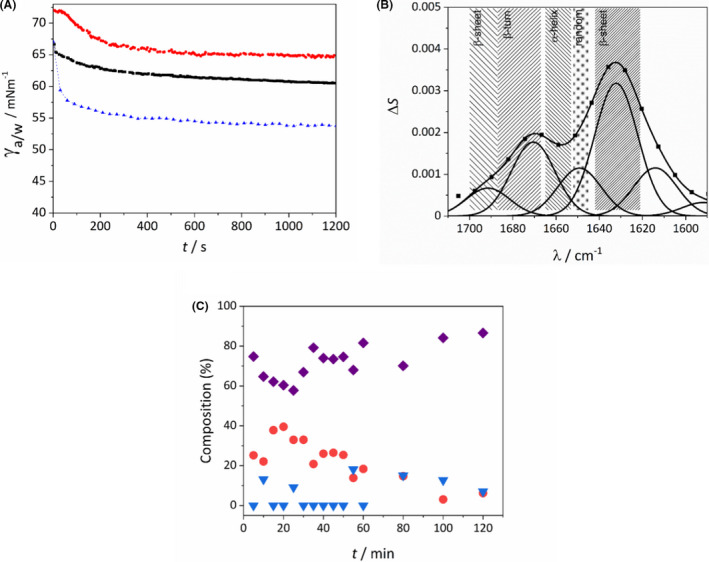
Fig. 2.

(A) Time dependence of the surface tension (γ) of ovalbumin (OVA, red dots), E5 (black rectangles) and bovine serum albumin (BSA, blue triangles) at solution/air surface, OVA and BSA are included as a reference. (B) Representative PM‐IRRAS spectrum of E5 recorded at the air–water interface at 15 °C. (C) Secondary structure composition (purple rectangles: β‐sheets; red circles: α‐helices and random coil structures; blue triangles: β‐turn motives) of E5 interfacial films at 15 °C as a function of film age.
