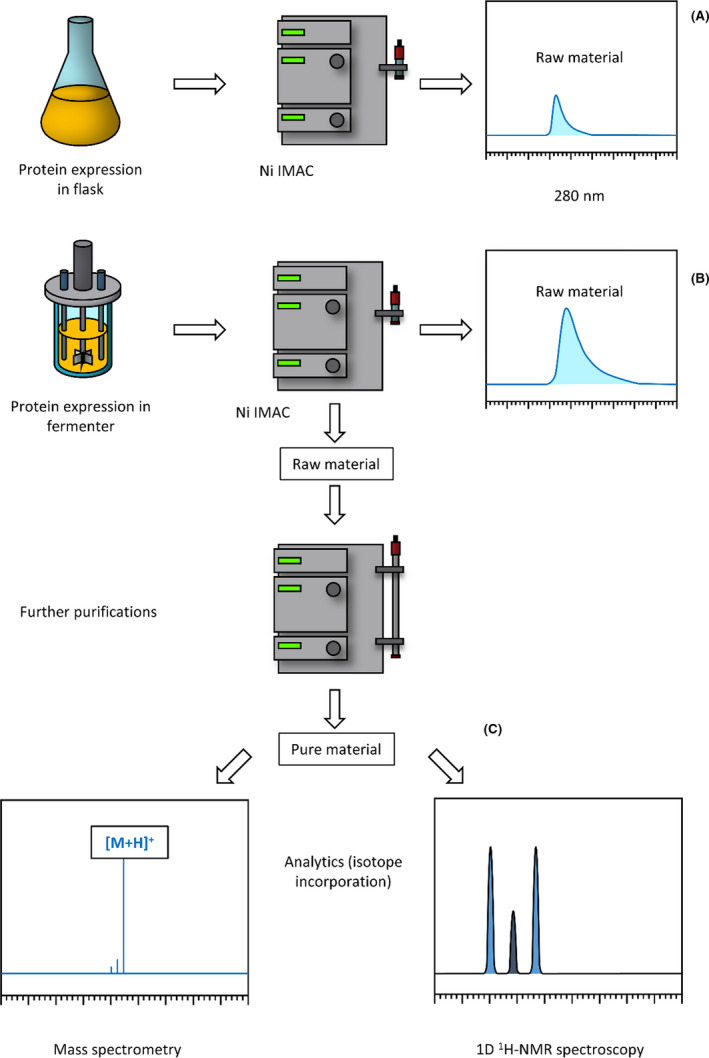
Fig. 4.

The comparative scheme of protein expression using either a flask or fermenter completed with both product purification and spectroscopy (MS and 1H‐NMR) measurements. (A) and (B) routes stand for direct raw material yield measurements obtained either by flask or fermenter. (C) route depicts raw material purification followed by quality control measurements such as isotope incorporation with NMR spectroscopy.
