
Fig. 1.
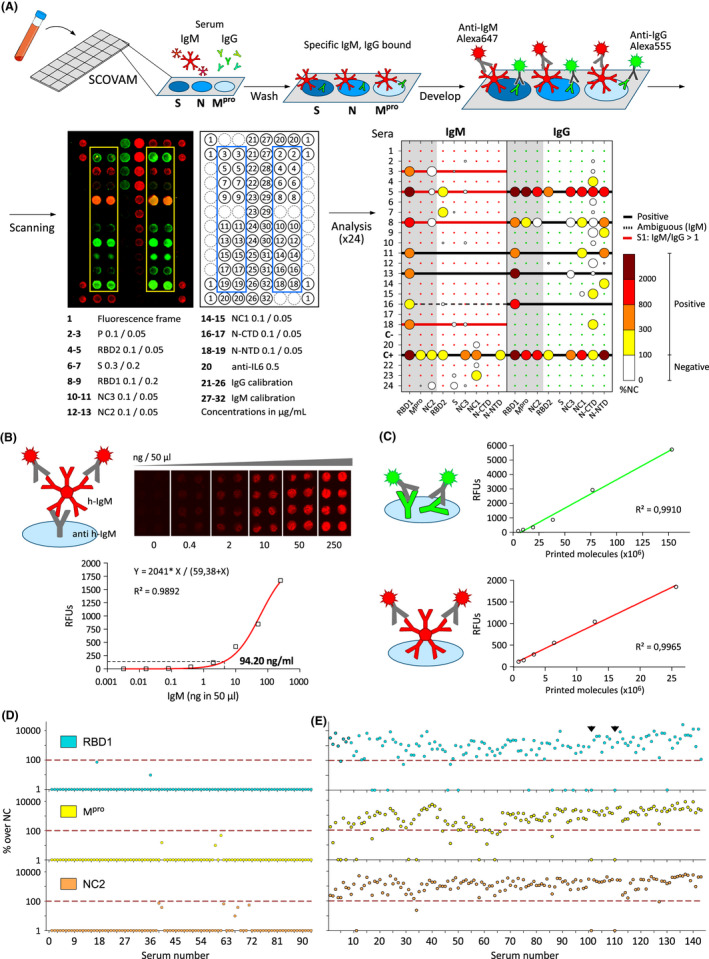
A. SCOVAM assay. Blood serum samples were incubated on 3 x 8 microarrays printed with viral proteins spike (S), nucleocapsid (N) and the main protease (Mpro). It was developed with fluorescent anti‐IgM (red) and anti‐IgG (green) antibodies. Fluorescent images were analyzed using Matlab to determine positive tests according to the relative fluorescence compared with the negative control.
B. Determination of the detection limit of the assay using known h‐IgM concentrations detected with anti‐IgM fluorescent antibodies.
C. Example of internal IgG (green) and IgM (red) calibration curves of each microarray.
D and E. A set of 89 negative (D) and 143 positive (E) sera were used to settle the threshold for positive determination (red line). Arrowheads: negative sera amongst positives, determined with SCOVAM.