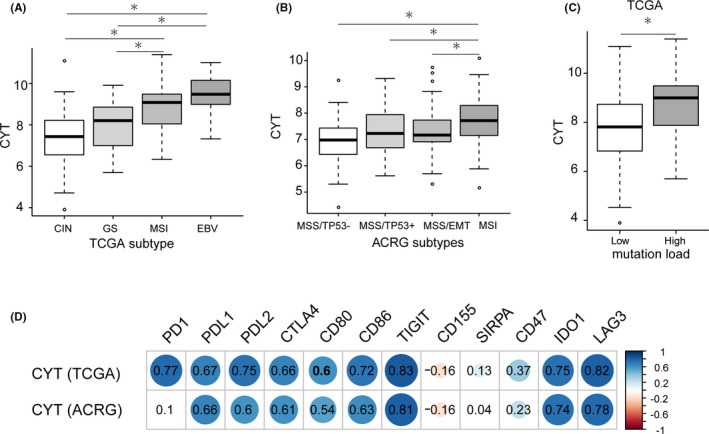
FIGURE 2.

The cytolytic activity (CYT) score associations with molecular subtypes, high mutation load, and immune checkpoint molecules in gastric cancer (GC). (A) CYT score in The Cancer Genome Atlas (TCGA) molecular subtypes. CIN, chromosome instability, n = 50; GS, genome stable, n = 47; MSI, microsatellite instability, n = 107; EBV, Epstein–Barr virus, n = 23. *represented Mann–Whitney U test p < 0.01. (B) CYT score in ACRG molecular subtypes. MSS, microsatellite stable, MSI, microsatellite instability, EMT, epithelial mesenchymal transition. MSS/TP53−: n = 107, MSS/TP53+: n = 79, MSS/EMT: n = 46, MSI: n = 68. *represented Mann–Whitney U test p < 0.01. (C) CYT score in GC samples with low (n = 185) or high (n = 51) mutation load from TCGA. Low mutation load was defined as total mutation numbers below 500, and high mutation load was defined as total mutation numbers above 500. *represented Mann–Whitney U test p < 0.01. (D) The correlations of immune checkpoint molecules with CYT score in GC samples from TCGA (n = 238) and Asian Cancer Research Group (ACRG) (n = 300), respectively. The values in each box represented the Pearson correlation coefficient. Red represented a negative correlation, and blue represented a positive correlation. The darker the color, the higher the correlation was (p < 0.05). No color (white) represented no significance (p ≥ 0.05).
