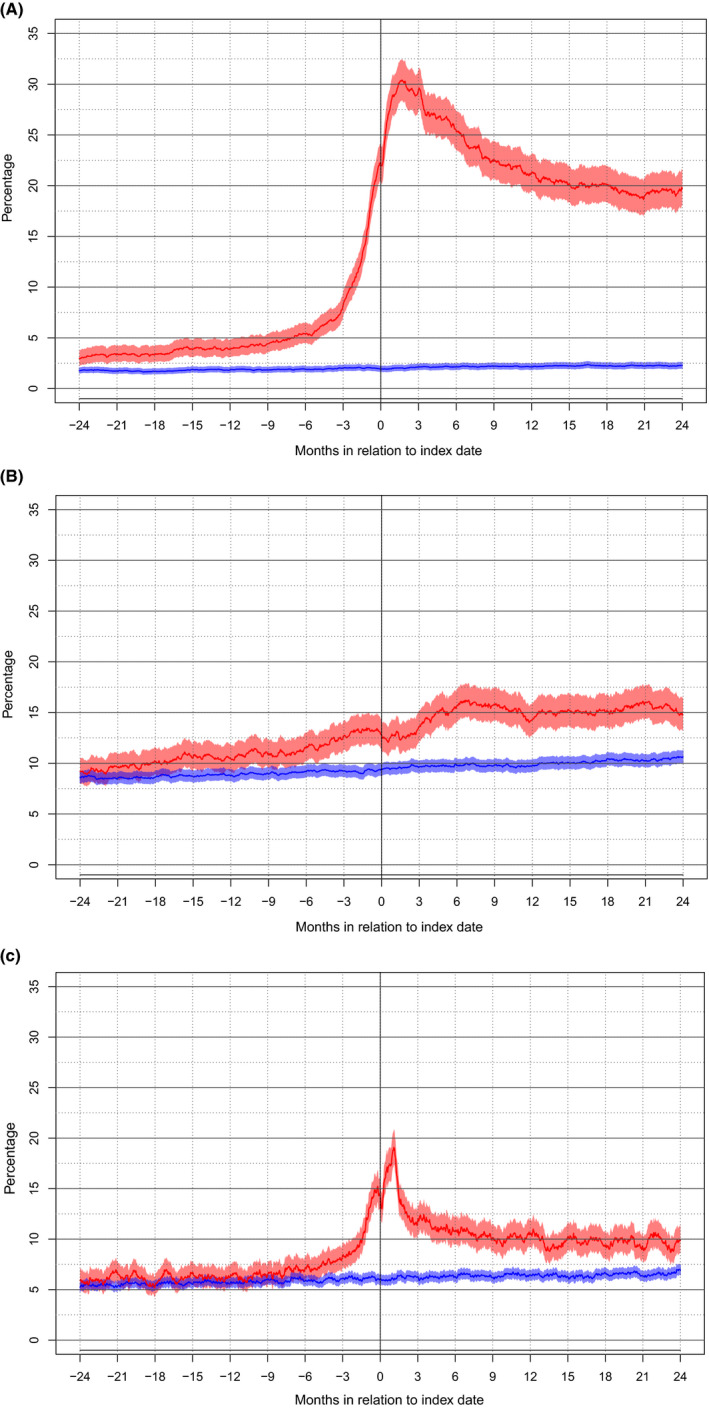
FIGURE 2.

(A‐C) Graph representing the proportions (95% CI) of patients (red) and controls (blue) with active use of the following prescription groups two years prior to index date through two years following index date: (A) AED, (B) Antidepressants, (C) Sedatives
