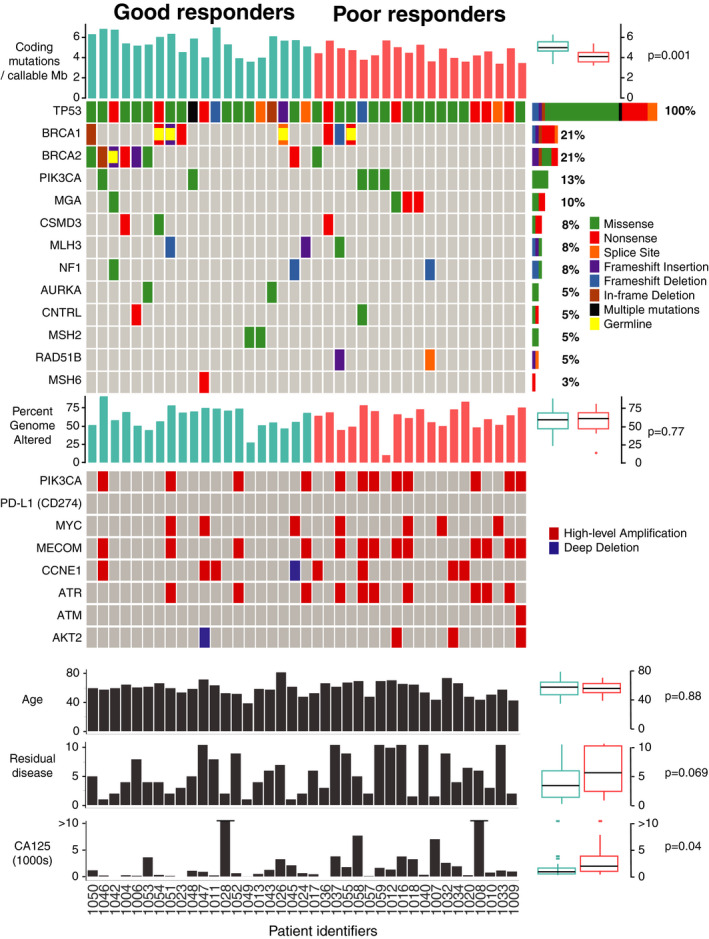
FIGURE 1.

Summary of genetic alterations in the good and poor response cohorts to first line platinum doublet chemotherapy. Each column represents one patient's tumor sample. Tumor mutation burden (TMB) expressed as the number of nonsynonymous mutations per number of callable coding bases (Mb) in each sample. The value for each case is represented by a bar graph, with a summary of results to the right of the panel, expressed as a boxplot with the median bracketed by first and third quartiles and whiskers showing points within 1.5 times the interquartile range and outliers shown as individual points. p = 0.001 by Wilcoxon rank‐sum test. OncoPrint summary of genetic alterations (as described in adjacent legend) in the most frequently altered genes for each tumor sample. Overall frequency of alterations for each gene are listed as a percentage to the right of the panel. BRCA1 and BRCA2 are marked as germline mutations if germline status was reported in the clinical chart. Percent genome altered (including amplification and deletions) is shown, per subject, in a bar graph and summarized to the right of the panel as a boxplot, with p = 0.77 by Wilcoxon rank‐sum test. Amplifications (defined as CNVs with log2R > 0.7) and deletions (defined as CNVs with log2R < −0.7) are visually represented in an oncoprint diagram for each case. Clinical characteristics (age, residual disease, and CA125) are expressed for each patient in a bar graph, with the boxplot summary to the right of the panel, p values were calculated using the Wilcoxon rank‐sum test
