FIGURE 2.

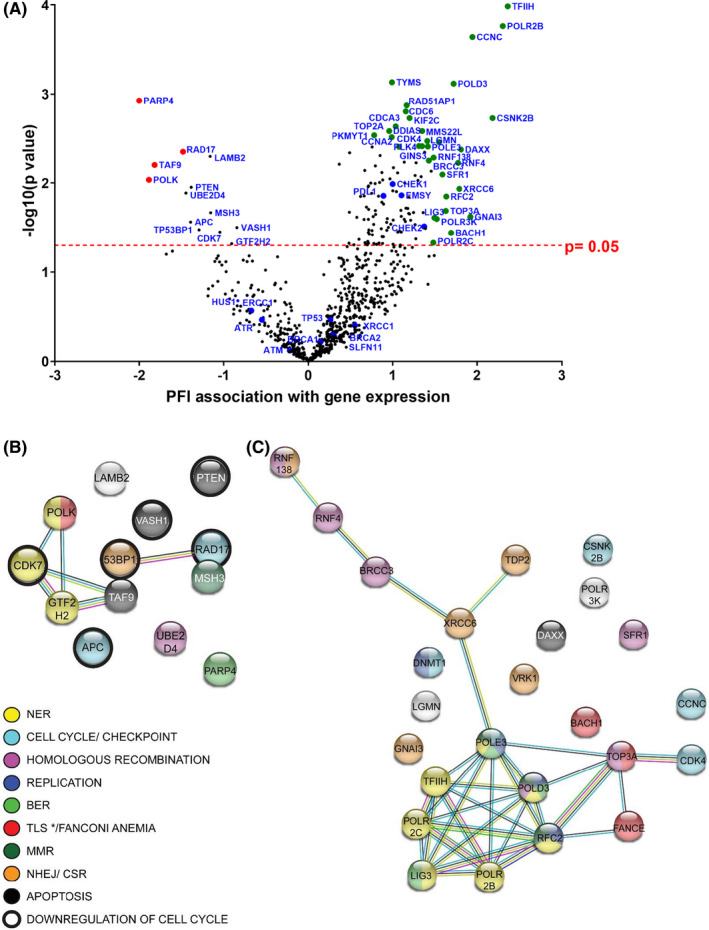
Transcriptomic analysis of tumor samples from good (GR) and poor (PR) responders using NanoString DDRmax codeset. (A) Volcano plot showing correlation of gene expression with patient PFI (X axis, greater value correlates with longer PFI). Y axis represents the level of confidence of the statistical analysis for each gene (p value 0.05 is depicted by a dashed line and was used as a cut‐off value). Green and red dots: genes best correlated to long and short PFI, and with lowest p value (list expanded in Table S3), blue dots: DDR genes closely examined. Protein association networks of top genes the expression of which correlates best with shorter PFI (B) and longest PFI (C) (left and right genes on volcano plot, respectively), with a p value < 0.05. Color code refers to curated KEGG pathways, where * denotes that TLS is specific to the short PFI network. Pathways were generated with String software. Red color refers to Translesion synthesis in panel (B) and Fanconi Anemia pathway in panel (C). BER, base excision repair; MMR, mismatch repair; NER, nucleotide excision repair; NHEJ/CSR, nonhomologous end joining/class‐switch recombination; TLS, translesion synthesis
