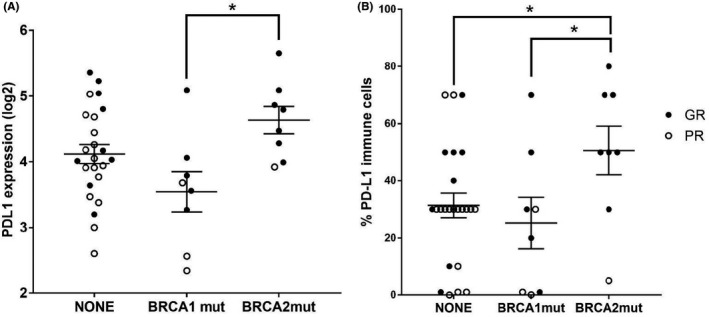
FIGURE 4.

Transcriptomic and immunohistochemical (IHC) analysis of tumor samples from good (GR) and poor (PR) responders establishes a link between BRCA mutation status and PD‐L1 expression in tumors and tumor associated immune cells. (A) PD‐L1 mRNA expression in tumors from both response groups classified by BRCA1 and BRCA2 mutation status. Data shown as mean ± SEM (* indicates p = 0.013). (B) Percentage of PD‐L1 protein expression in tumor immune cells, assessed by IHC, within tumors from both response groups, based on BRCA1 and BRCA2 mutation status. Data shown as mean ± SEM (* and ** indicate p = 0.029 and p = 0.01, respectively)
