
Figure 4: Functional and molecular specialization of Treg cell populations.
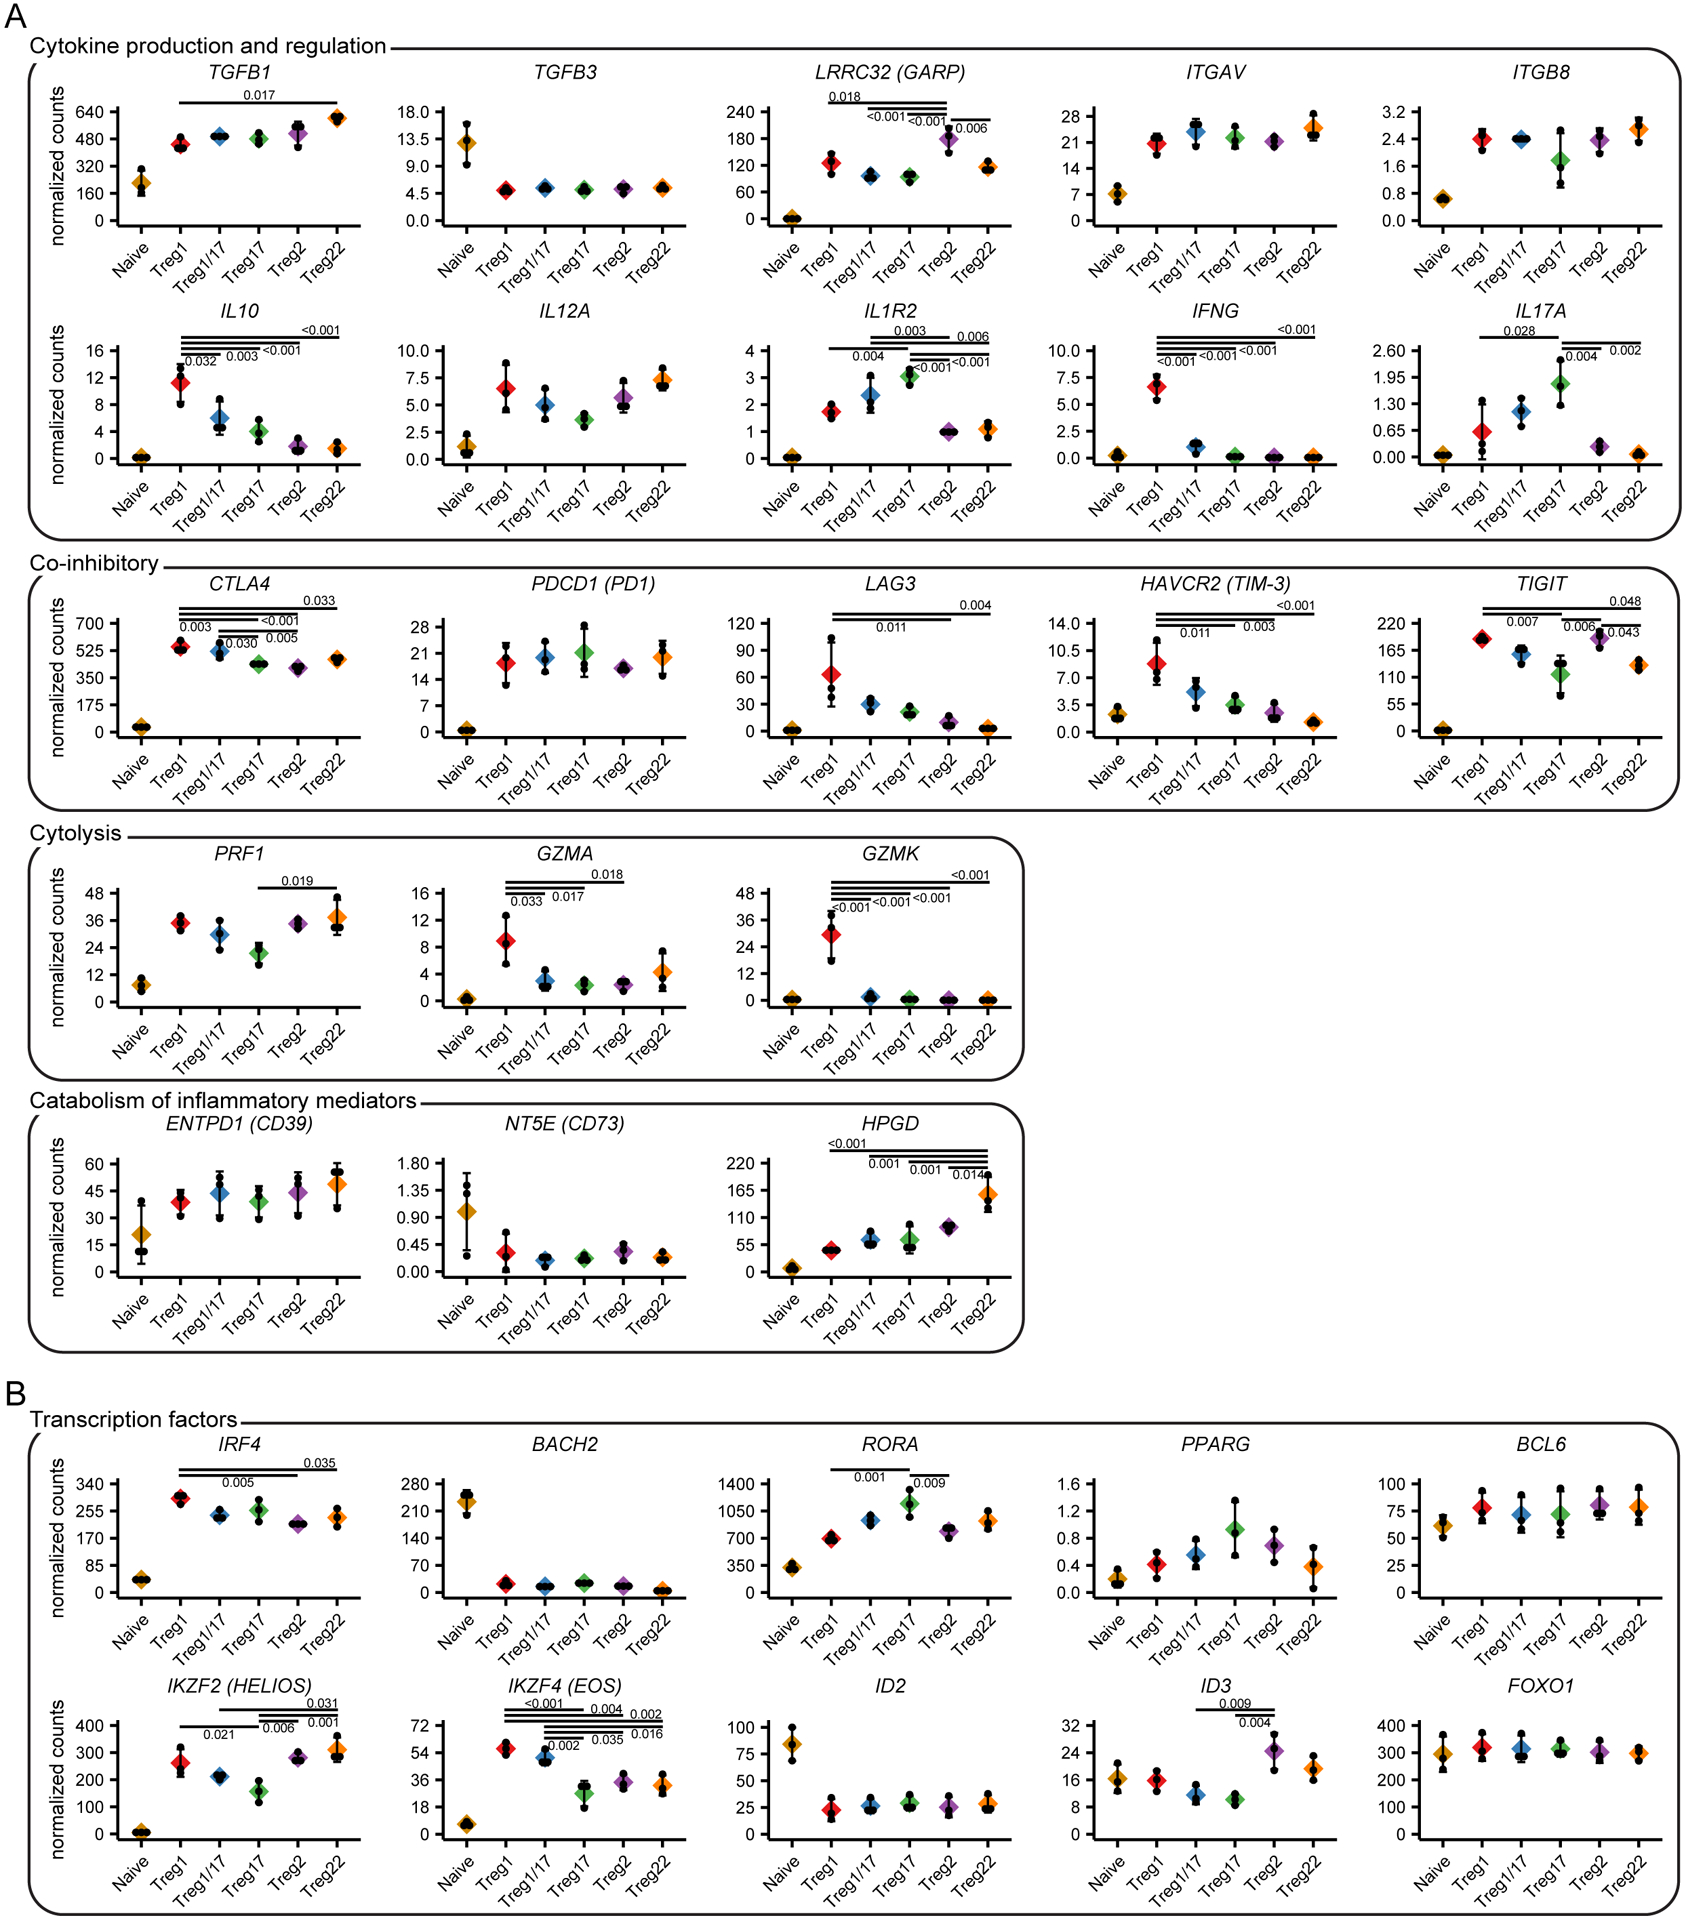
A) Expression analysis of genes controlling different functions of Treg cells as indicated. B) Expression analysis of transcription factors implicated in Treg specialization. Values represent batch-effect corrected counts per million. Significance levels were determined by ANOVA followed by TukeyHSD for testing pairwise differences. Significant differences with the naïve samples are not highlighted.