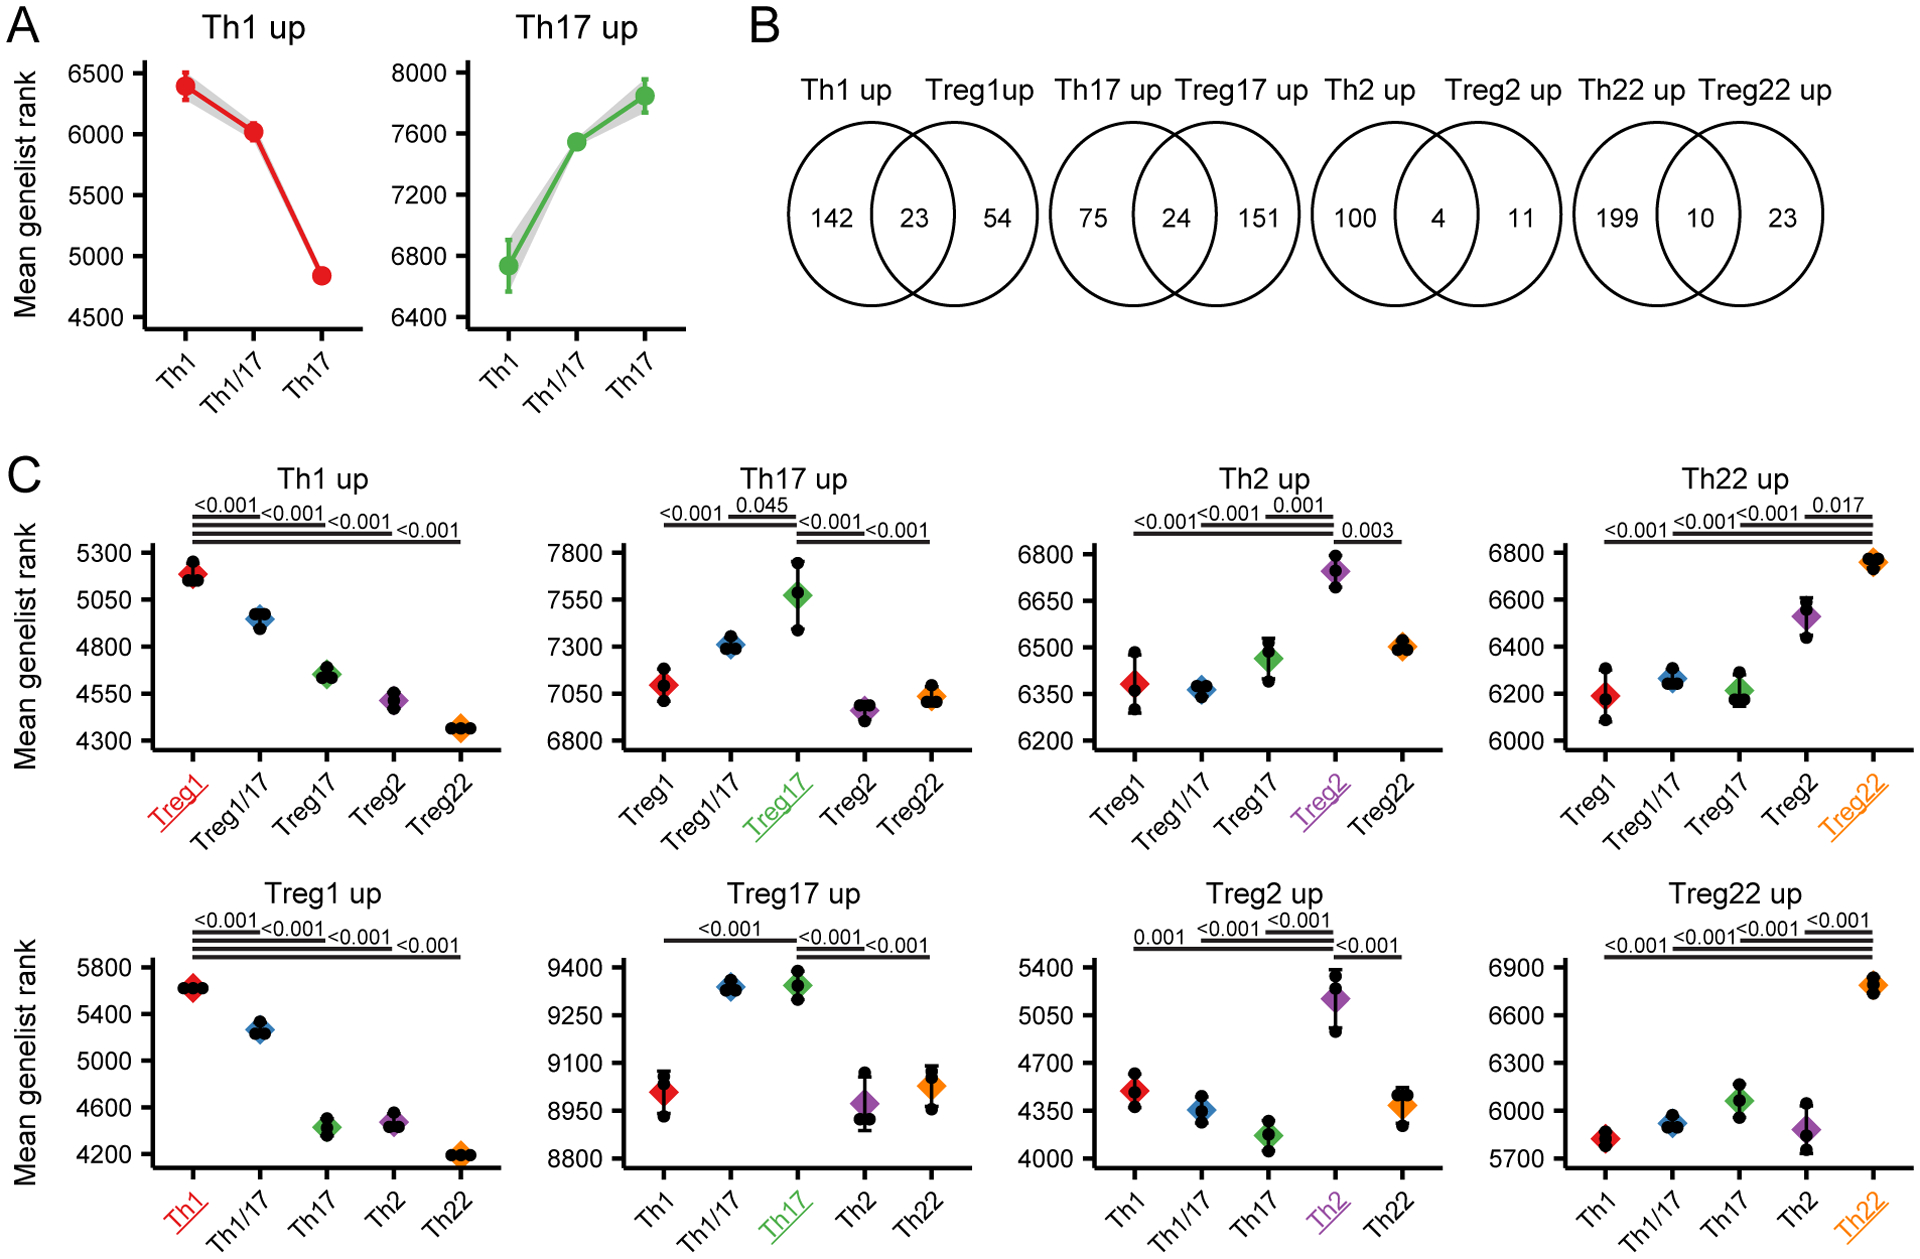
Figure 6: Shared transcriptional signatures of mirror Th and Treg cell populations.

A) Mean genelist rank of the Th1/17 subset compared to the Th1 and the Th17 subset examining genes significantly upregulated in the Th1 (left) and Th17 (right) populations. B) Venn diagram showing the overlap in genes specifically upregulated in mirror Th and Treg cell populations. C) Mean genelist rank of Th signature genes in each Treg cell population (top), or mean genelist rank of Treg signature genes in each Th cell population (bottom) as indicated. Significance determined by ANOVA followed by Tukey HSD, and significantly different comparisons with the population of interest (highlighted with color) are indicated.
