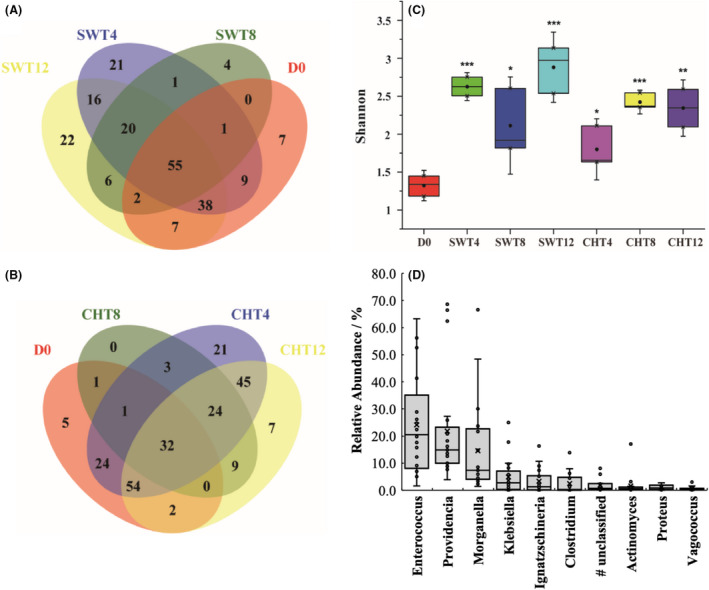
Fig. 4.

(A,B) Venn diagram of the unique and shared OTUs of microbes in the gut of BSFL in swine manure (SWT, A) and chicken manure (CHT, B) treatment systems; (C) Shannon indices for each group sample (n = 3); and (D) relative abundances of the 10 genera (core genera) existing in all samples (n = 21). The box plots denote 25th to 75th percentile; horizontal line: median; whiskers: 10th and 90th percentile; and ×: mean. *: 0.01 < P ≤ 0.05; **: 0.001 < P ≤ 0.01; ***: P ≤ 0.001, compared to D0. #: unclassified in Enterobacteriaceae.
