
Fig. 5.
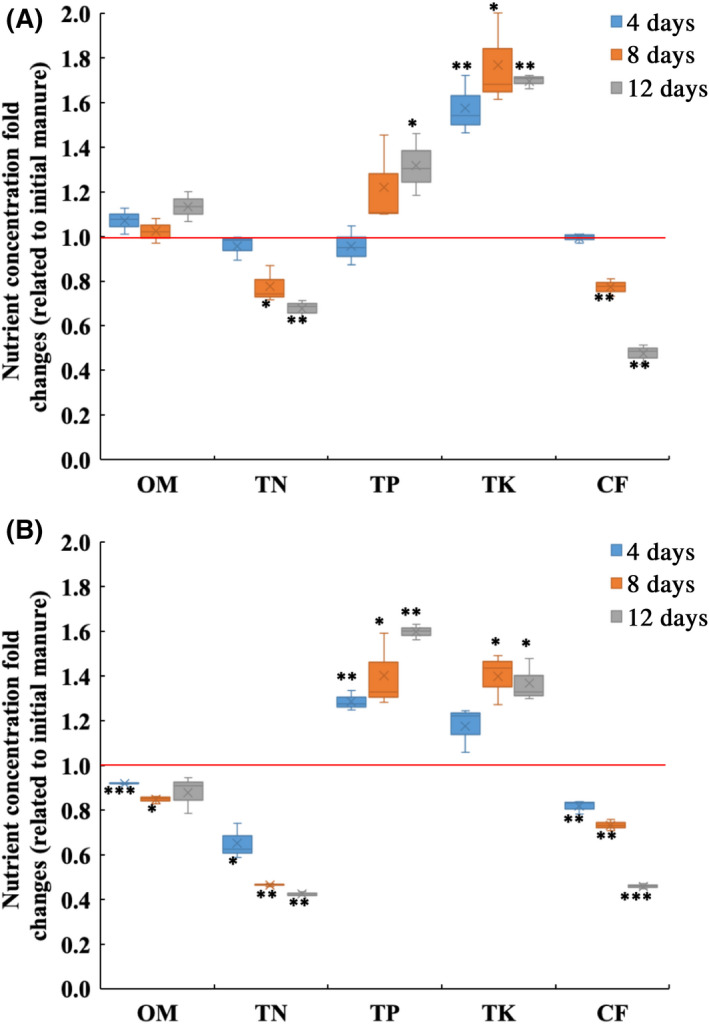
The fold changes (related to initial manure) of nutrient concentration (n = 3) in (A) swine manure and (B) chicken manure treatment systems. OM: organic matter; TN: total nitrogen; TP: total phosphorus; TK total potassium; and CF: crude fat. The box plots denote 25th to 75th percentile; horizontal line: median; whiskers: 10th and 90th percentile; and ×: mean. *: 0.01 < P ≤ 0.05; **: 0.001 < P ≤ 0.01; ***: P ≤ 0.001, according to Student’s t‐test.