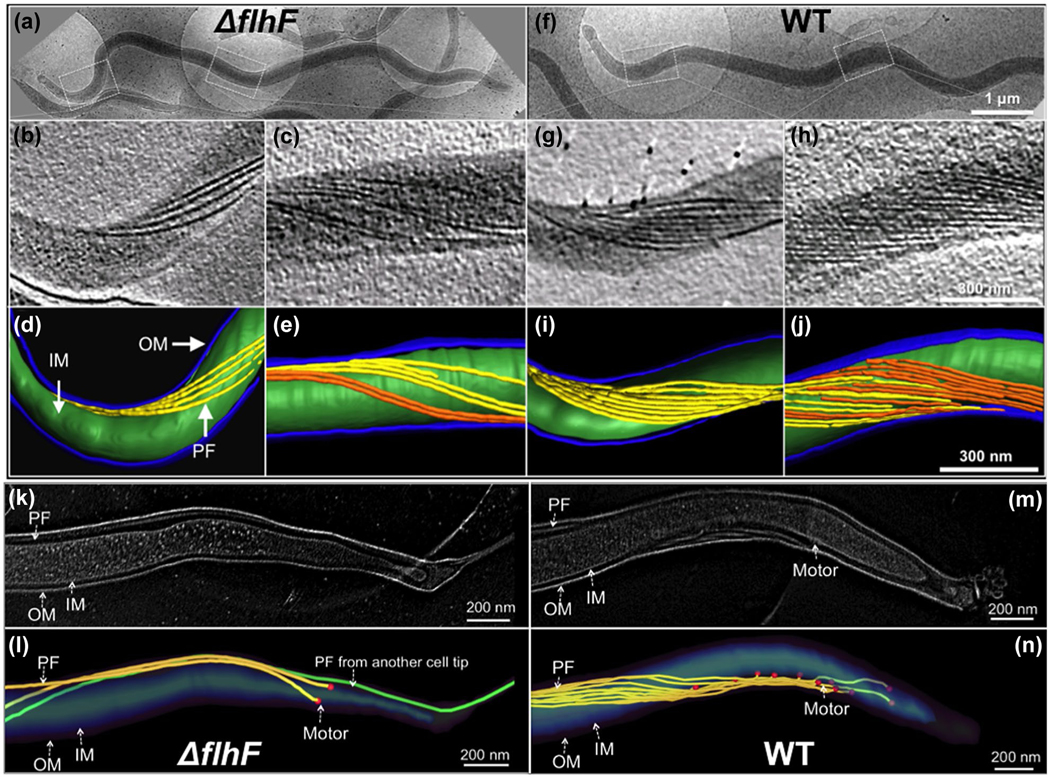
FIGURE 3.
Cryo-ET analysis reveals that the ΔflhF mutant has less PF. (a) Low magnification image of a ΔflhF cell showing the overview of the cell shape. Two boxed regions in the cell tip and body were imaged by cryo-ET. (b) A section of ΔflhF cell tomogram showing four PF originated from the cell tip. (c) A section of ΔflhF midcell tomogram showing the flagellar filaments are loosely distributed along the cell body. (d, e) 3D segmentations of the ΔflhF mutant cell tip and the cell body. (k, l) High magnification image of ΔflhF cell tip tomogram and 3D segmentation. (f) Low magnification image of a WT cell. (g) A section of WT cell tomogram showing eight PF originated from the cell tip. (h) A section of WT midcell tomogram showing the flagellar filaments from both cell ends are overlapped and tightly organized into a flat-ribbon. (i, j) 3D segmentations of a WT cell tip and the cell body. (m, n) High magnification image of WT cell tip tomogram and 3D segmentation. OM: outer membrane; IM: inner membrane

