Figure 1.

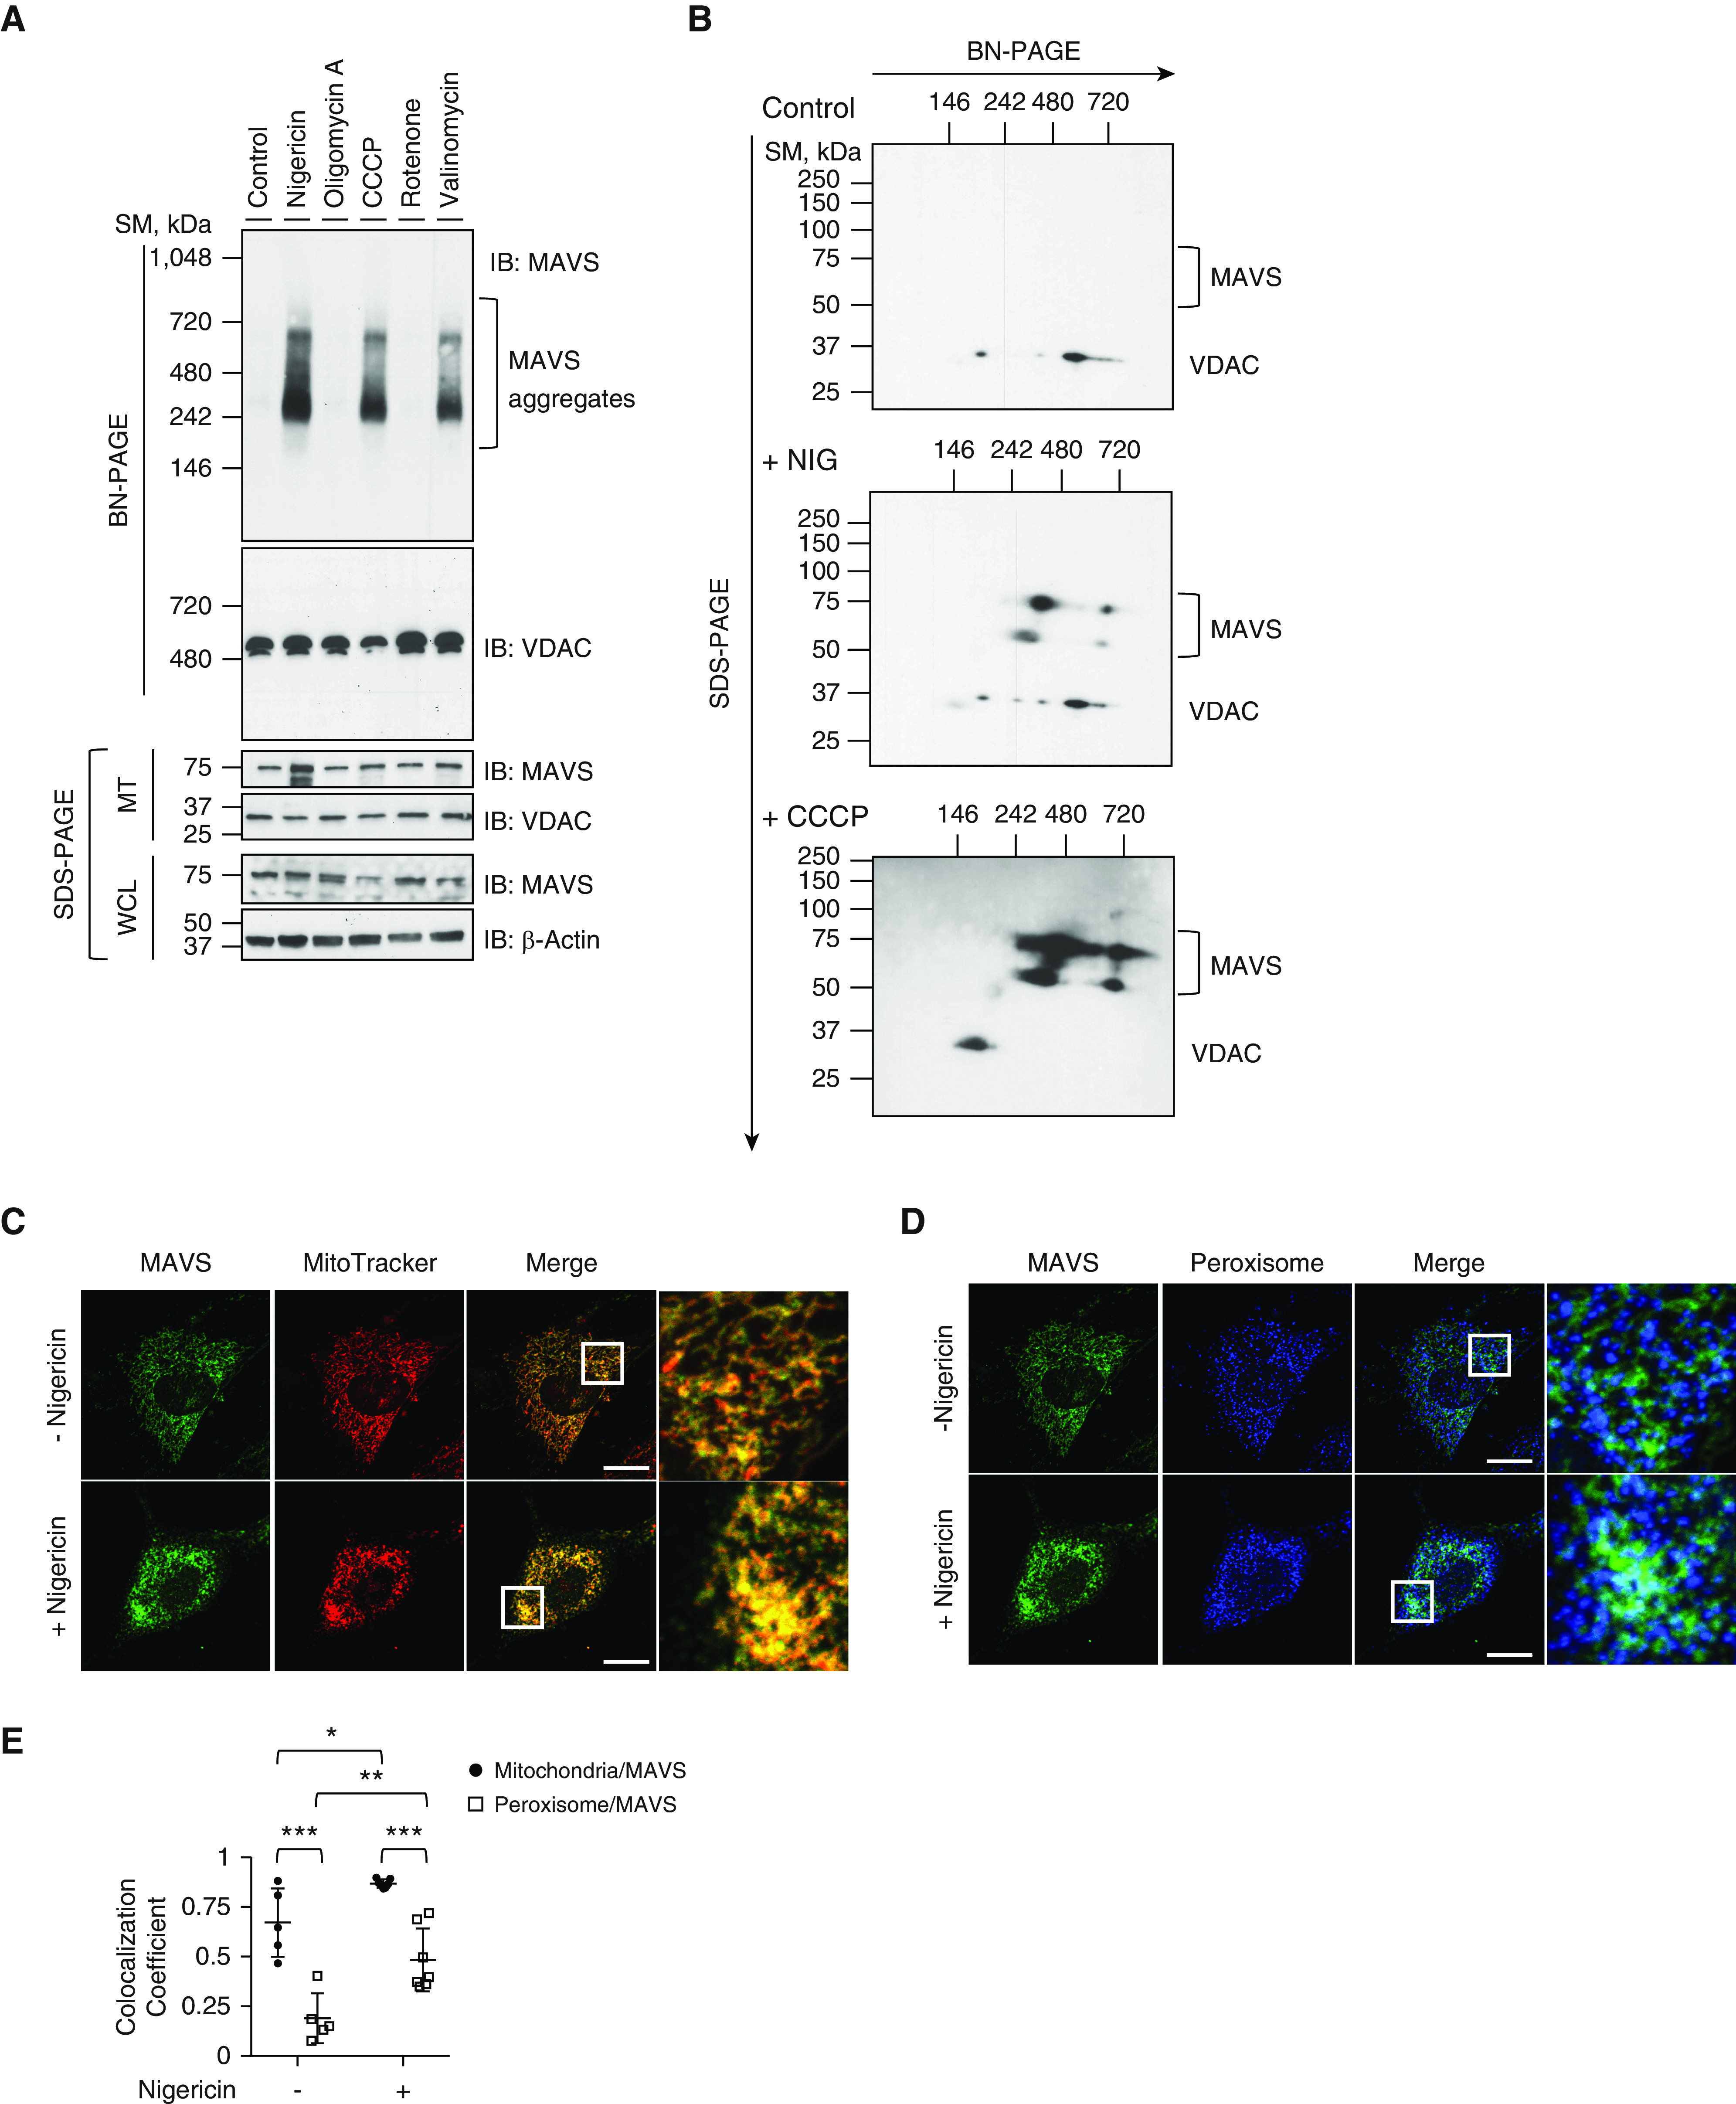
MAVS (mitochondrial antiviral signaling protein) aggregation by mitochondrial drugs. (A) Human embryonic kidney 293 (HEK293) cells were stimulated with 5 μM of nigericin, 5 μM of oligomycin A, 50 μM of carbonyl cyanide m-chlorophenyl hydrazone (CCCP), 1 μM of rotenone, or 10 μM of valinomycin for 1 hour. MTs were separated and loaded to blue native PAGE (BN-PAGE). The MAVS aggregation was analyzed by Western blot. Voltage-dependent anion channel (VDAC) was used as the loading control for mitochondrial analysis. (B) HEK293 cells were stimulated with 5 μM of nigericin or 50 μM of CCCP for 1 hour. Mitochondrial fractions were separated and loaded to BN-PAGE. For two-dimensional analysis, each lane was excised and loaded on second-dimension SDS gel. The MAVS aggregation was analyzed by Western blot. VDAC was used as the loading control. Readers may view the uncut gels for A and B in the data supplement. (C–E) Mouse embryonic fibroblasts from wild-type mice were coimmunostained with MitoTracker Orange CMTMRos (red, C) and MAVS (green, C) or with PMP70 (blue, D) and MAVS (green, D). The images for localization of MAVS and its aggregates were acquired by confocal microscopy. (E) Colocalization of MAVS to mitochondria or peroxisome was analyzed using ZEN2010 software. Scale bars, 20 μm. All experiments are repeated at least three times. Representative results are shown. Means ± SD. *P < 0.05, **P < 0.01, and ***P < 0.001. MT = mitochondrial fraction; PINK1 = PTEN-induced kinase 1; SDS-PAGE = sodium dodecyl sulfate-PAGE; SM = size marker; WCL = whole cell lysate.
