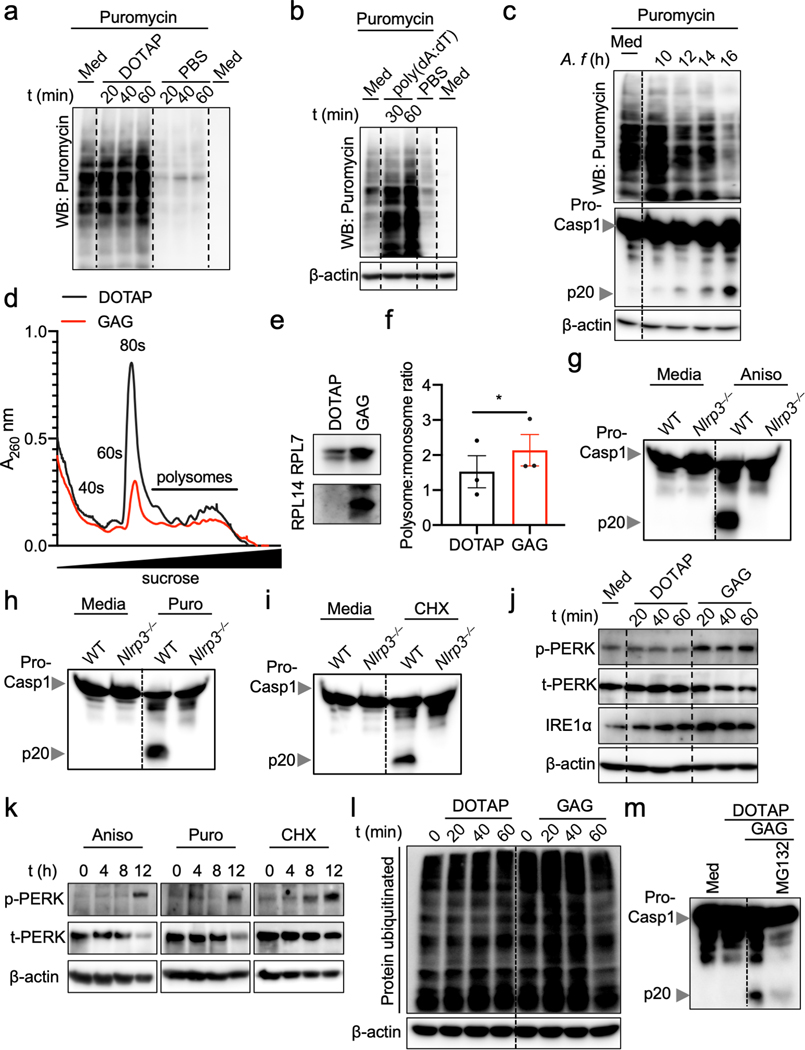
Extended Data Fig. 6. GAG inhibits translation and induces endoplasmic stress.
a-c Immunoblot analysis of translation rate in bone marrow-derived macrophages (BMDMs) by puromycin integration into proteins during (a) vehicle (DOTAP) or PBS incubation, (b) poly(dA:dT) transfection or (c) A. fumigatus (A. f) infection and caspase-1 activation during A. f infection. Representative images (n ≥ 2 independent experiments). d, Polysome profiling during DOTAP or DOTAP + GAG treatments. e, Immunoblot analysis of the cell pellet after polysome profiling. Representative images (n ≥ 2 independent experiments). f, Polysome:monosome ratio during DOTAP or DOTAP + GAG treatments. Data are mean +/− SEM. *P = 0.0366 (paired two-tailed t-test) (n = 3 biologically independent samples). g−i, Immunoblot analysis of pro–caspase-1 (pro-Casp1; p45) and the active caspase-1 subunit (p20) of wild type (WT) or Nlrp3−/− BMDMs assessed after 16 h incubation with (g) 25 μg/mL anisomycin (Aniso), (h) 50 μg/mL puromycin (Puro) or (i) 50 μg/mL cycloheximide (CHX). Representative images (n ≥ 2 independent experiments). j,k, Immunoblot analysis of PERK activation (p-PERK) and IRE1α induction during (j) GAG transfection or (k) PERK activation during treatment with translation inhibitors. Representative images (n ≥ 2 independent experiments). l, Immunoblot analysis of proteins ubiquitinated during GAG transfection. Representative images (n ≥ 2 independent experiments). m, Immunoblot analysis of caspase-1 of BMDMs left untreated (medium alone [Med]) or assessed 3 h after transfection with GAG and treated with MG132. Representative images (n ≥ 2 independent experiments).

