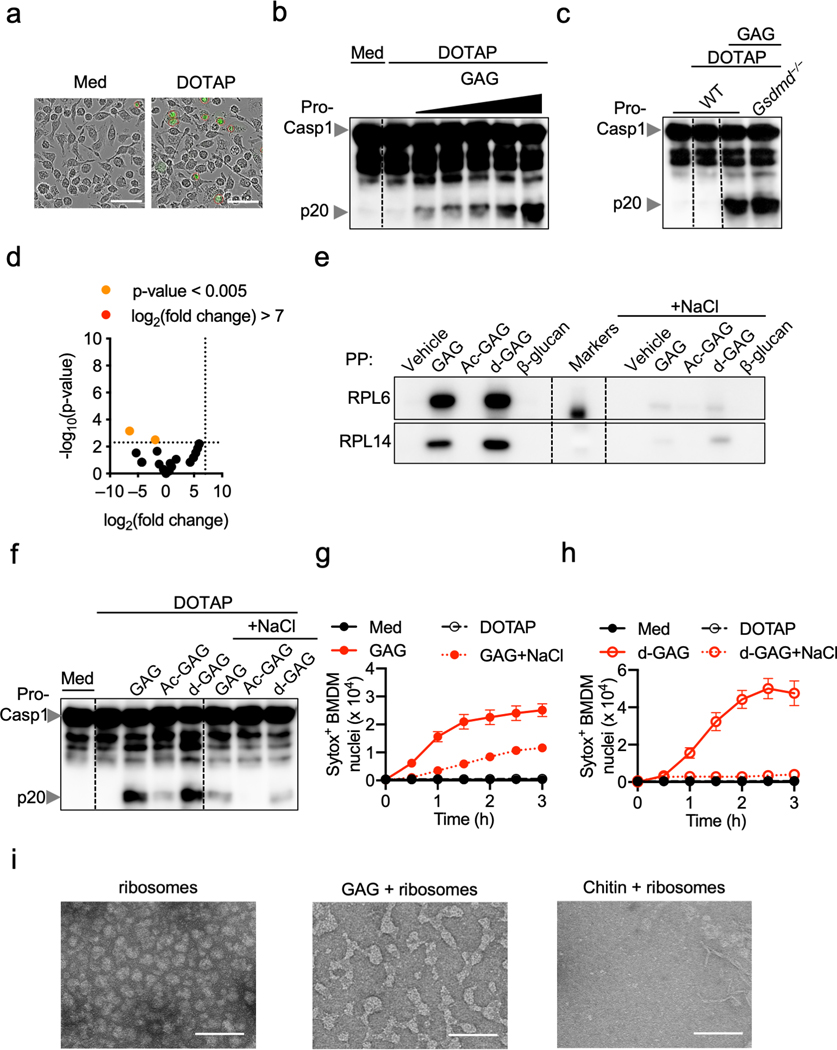
Extended Data Fig. 5. GAG induces caspase-1 cleavage in a dose- and charge-charge interaction-dependent manner and interacts with ribosomes.
a, Representative images of bone marrow-derived macrophages (BMDMs) in medium (Med) or during treatment with DOTAP alone (green fluorescence corresponds to Sytox green nuclei, and Sytox green-positive nuclei are marked with a red circle). Scale bars, 10 μm. Representative images (n ≥ 3 independent experiments). b, Immunoblot analysis of pro–caspase-1 (pro-Casp1; p45) and the active caspase-1 subunit (p20) of BMDMs left untreated (medium alone [Med]) or assessed 3 h after transfection with increasing concentrations of GAG or vehicle alone (DOTAP). Representative images (n ≥ 3 independent experiments). c, Immunoblot analysis of caspase-1 during transfection with GAG in wild type (WT) and Gsdmd−/− BMDMs. Representative images (n ≥ 3 independent experiments). d, Volcano plot of the polysaccharide pull down mass spectrometry analysis of the β-glucan interactome with BMDM cytosolic proteins versus control. Proteins with P value < 0.005 are orange highlighted and proteins with P value < 0.005 and log2(fold change) > 7 compared to control are red highlighted (none identified); P value was determined by the G-test and exact P values are presented in Supplemental Table 1. e, Immunoblot analysis of ribosomal proteins interacting with GAG, Ac-GAG, d-GAG or β-glucan or vehicle with or without NaCl. Representative images (n ≥ 3 independent experiments). f, Immunoblot analysis of caspase-1 from BMDMs assessed after 3 h incubation with GAG, Ac-GAG or d-GAG with or without NaCl. Representative images (n ≥ 3 independent experiments). g, h, Measurement of cell death by Sytox green staining during GAG and d-GAG treatment with or without NaCl (n = 3 biologically independent samples). Data are mean +/− SEM. i, Electron microscopy pictures of ribosomes, GAG + ribosomes and chitin + ribosomes with negative staining; data from one experiment. Scale bars, 100 nm.

