Fig. 5.
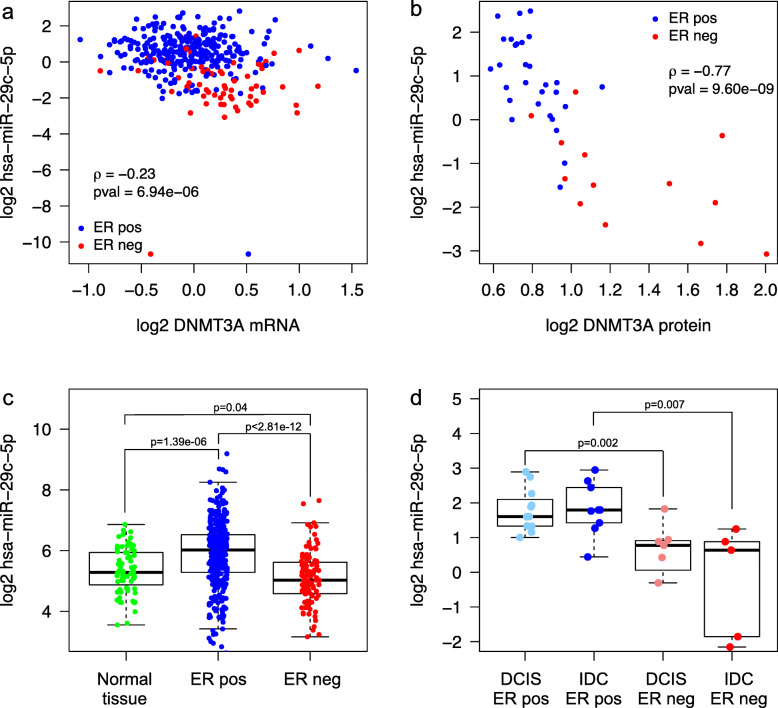
Expression of hsa-miR-29c-5p and correlation to DNMT3A. a DNMT3A mRNA expression (x-axis) vs. hsa-miR-29c-5p expression (y-axis) measured in 377 samples of the Oslo2 cohort. Estrogen receptor (ER)-positive (pos) tumors are plotted in blue and ER-negative (neg) in red. Spearman correlation coefficient (rho: ρ) and p value (pval) indicated. b DNMT3A protein expression (x-axis) vs. hsa-miR-29c-5p expression (y-axis) measured in 45 samples of the Oslo2 cohort. c hsa-miR-29c-5p expression in normal adjacent breast tissue (Normal tissue; n = 76), ER-positive (n = 333) and ER-negative tumors (n = 106) of the TCGA cohort. Wilcoxon rank-sum test p values are denoted. d hsa-miR-29c-5p expression in ER-positive (n = 11) and ER-negative (n = 7) ductal carcinoma in situ (DCIS) samples and ER-positive (n = 9) and ER-negative (n = 5) invasive ductal carcinoma (IDC) samples from the same data set [13]. Wilcoxon rank-sum test p values are denoted

