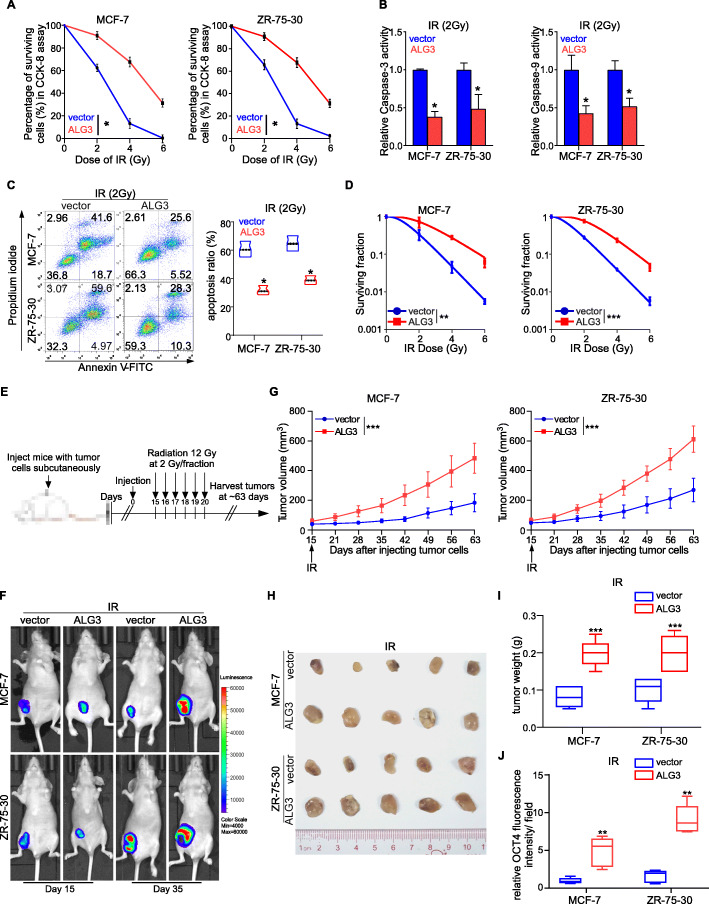
Fig. 2.
ALG3 overexpression contributes to radioresistance. a Surviving fraction of MCF- 7 and ZR-75-30 cells irradiated with 0, 2, 4, and 6 Gy X-rays and cultured for 72 h were detected by CCK-8 assays. Data were analyzed by two-way ANOVA with Bonferroni’s post test. Each bar represents the mean ± SD of three independent experiments. b Caspase-3 and Caspase-9 activity in MCF- 7 and ZR-75-30 cells. Data were analyzed by Student’s t-test. Each bar represents the mean ± SD of three independent experiments. c Apoptosis ratio of MCF-7 and ZR-75-30 cells after 2 Gy radiation treatment and cultured for 72 h was detected by flow cytometry. Data were analyzed by Student’s t-test. Each bar represents the mean ± SD of three independent experiments; *P < 0.05. d The dose–survival curve was fitted using a multitarget single-hit statistical model by colony assay. Data were analyzed by two-way ANOVA with Bonferroni’s post test. e Model of treatment schedule in vivo studies. f Representative fluorescence graph of tumor-bearing mice with different ALG3 expression, which were treated with 2 Gy X ray. g Tumor growth rate was significantly increased in ALG3 transduced cells after radiation treatment. Data were analyzed by two-way ANOVA with Bonferroni’s post test. h Representative pictures of tumors from vector + IR, and ALG3-trancedced + IR mice were as shown. i The tumor weight of the vector group after radiation treatment and the tumor weight of the ALG3-tranceduced group after radiation treatment were calculated and shown. Data were analyzed by Student’s t-test. j The fluorescence intensity of OCT4 in ALG3-transduced cells relative to that in vector cells were measured. Data were analyzed by Student’s t-test. *P < 0.05, **P < 0.01, *** P < 0.001

