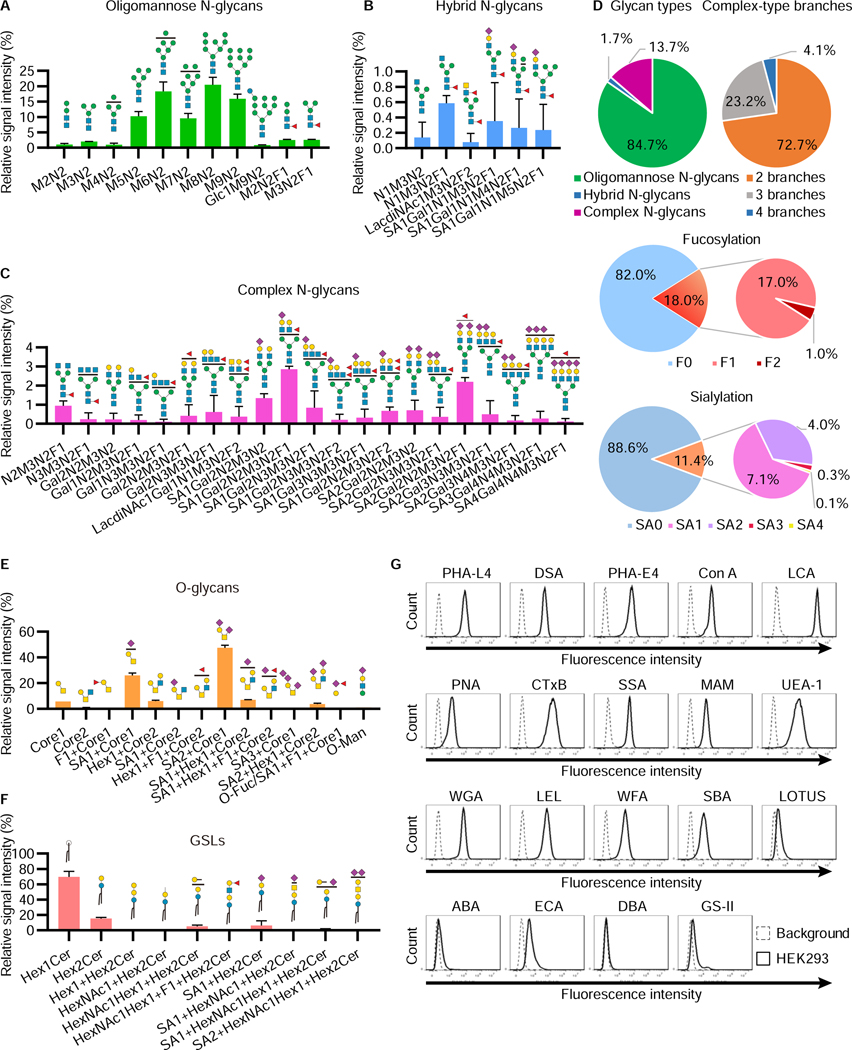
Figure 1. Glycomic analysis of HEK293 cells.
A–D, Relative abundance of N-glycans in HEK293 cells. Permethylated N-glycan structures in HEK293 cells were analyzed using NSI-MS. The relative abundances of oligomannose (A), hybrid (B), and complex (C) N-glycan structures are shown. The symbol of each sugar follows the SNFG (Neelamegham et al., 2019). Fucoses represented on the N-glycan structures are attached to either the core or branches on N-glycans. Those fucosylated structures were mixtures of both structures (See Figure S1B). The distribution of N-glycan-type structures and the branch number of complex structures are shown, as well as the number of fucoses and sialic acids on N-glycans (D). The data represent the means ± errors from two independent experiments.
E, F, Relative abundance of O-glycans (E) and GSLs (F) in HEK293 cells. The symbol of each sugar follows the SNFG. The blank circles and squares represent hexoses (Hex) and N-acetyl-hexosamines (HexNAc), respectively. The sugars such as fucose and sialic acid depicted at the top of each structure have multiple binding sites, which are represented as compositions (See Figure S1C, S1D, and Table S4). The data represent the means ± errors from two independent experiments.
G, Lectin staining of glycan structures on the cell surface. HEK293 cells were incubated with 19 lectins conjugated with fluorescein or biotin and analyzed by flow cytometry. The data show representative results from at least three independent experiments.

