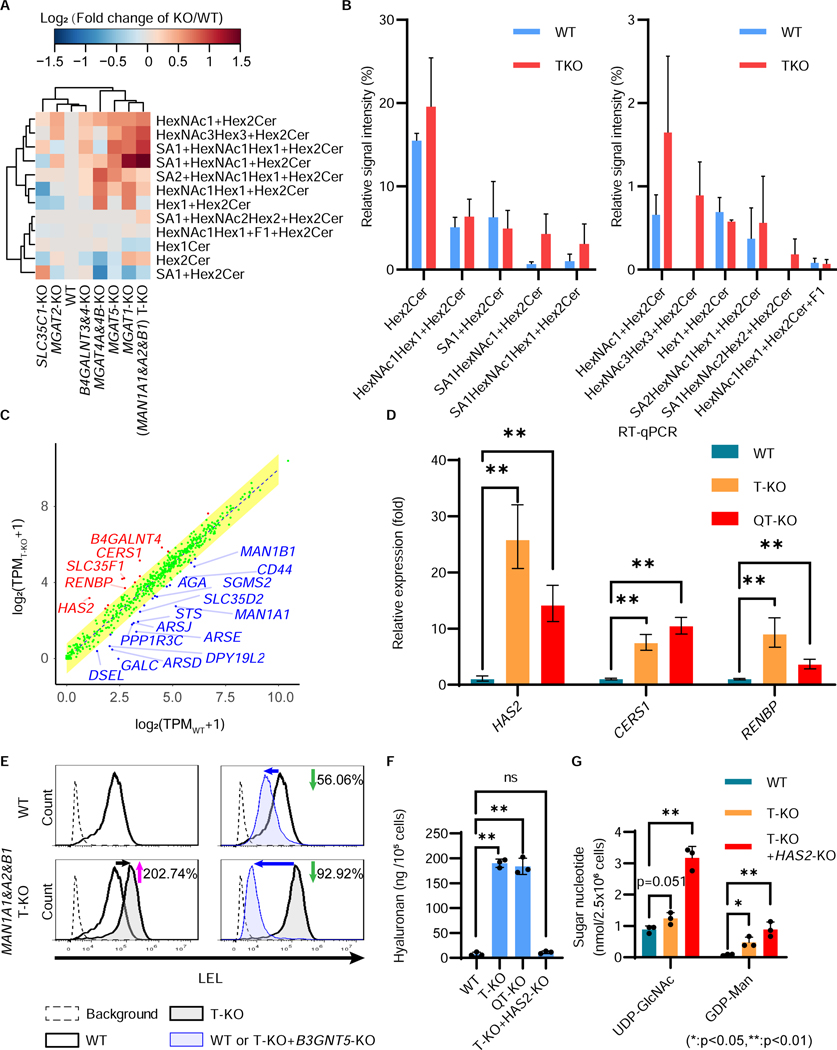
Figure 5. Increase of LacNAc-containing GSLs and hyaluronan in MAN1A1&A2&B1-T-KO cells.
A, Comparative GSL analysis of seven KO cells. Relative abundance of GSLs in HEK293 MAN1A1-, A2-, and B1-triple-KO (T-KO), MGAT1-KO, MGAT2-KO, MGAT4A&4B-KO, MGAT5-KO, B4GALNT3- and 4-KO, and SLC35C1-KO cells. The data are visualized as clustered heatmaps. The relative amounts of glycan structures in each cell type were calculated, and were compared with those of HEK293 cells. The log2 values of the data are visualized as heatmaps. The data used the mean value from two independent experiments.
B, Relative abundance of GSL species in HEK293 WT and T-KO cells. The data represent the means ± errors from two independent experiments.
C, Comparison of the expression of glycan-related genes in WT versus T-KO cells. TPM values (averages of triplicated data) were calculated and plotted as log2(TPM + 1) values. The yellow area represents the predicted interval expression in WT or T-KO cells. Representative examples of genes with higher expressions in WT or T-KO cells are indicated by blue or red text, respectively. It is noted that expression levels of genes MAN1A1 (0.16 fold), MAN1A2 (0.50 fold), and MAN1B1 (0.43 fold) were significantly down-regulated in T-KO cells, probably as results of nonsense-mediated mRNA decay.
D, Quantitative RT-PCR analysis of CERS1, HAS2, and RENBP mRNA levels mRNA levels in HEK293 WT, T-KO, and QT-KO cells. HPRT (hypoxanthine phosphoribosyltransferase) was used to normalize the data. The bars represent RQ (relative quantification) values ± RQmax and RQmin (error bars), from triplicate samples.
E, Enhanced LEL staining in MAN1A1&A2&B1-T-KO (T-KO) cells was due to an increase of GSLs. Flow cytometric analysis of cells stained by fluorescent-conjugated LEL. HEK293 wild-type (WT), T-KO, B3GNT5-KO, and T-KO+B3GNT5-KO cells were stained by fluorescent-conjugated LEL, and analyzed by flow cytometry. Background, without lectin staining.
F, The levels of hyaluronan in the culture media of WT, T-KO, and QT-KO cells were quantified. The bars represent the means ± SD from triplicate samples. P-values (two-tailed, student’s t-test) are shown.
G, Levels of UDP-GlcNAc and GDP-Man were analyzed using high-performance anion-exchange chromatography. The bars represent the means ± SD from triplicate samples. P-values (two-tailed, student’s t-test) are shown.

