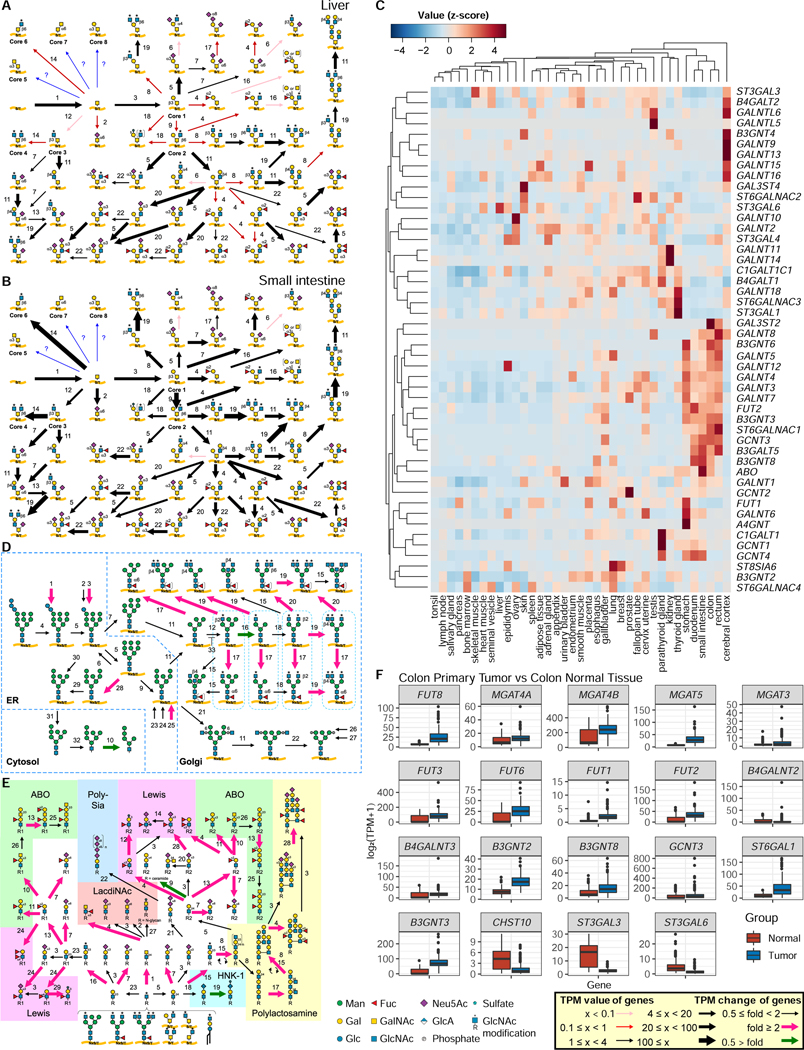
Figure 6. Comparison of glycosylation pathways among various tissues.
A and B, Mucin-type O-glycosylation pathways in the liver (A) and small intestine (B) were visualized using GlycoMaple, based on gene expression profiles in the Human Protein Atlas (HPA). Each numbered reaction is listed in Table S3.
C, Expression profiles of genes involved in mucin-type O-glycosylation in tissues. The TPM values of 48 genes required for mucin-type O-glycosylation in 37 human tissues deposited in the HPA were normalized (z-score) and are visualized as a clustered heatmap.
D and E, Comparison of pathways using GlycoMaple. Gene expression profiles (median TPM values) in primary tumor (N = 288) and normal (N = 304) colon tissues were used to show the pathways. Fold changes that were > 2 and < 0.5 are shown as pink and green arrows, respectively. Each numbered reaction is listed in Table S3.
F, Different expressions of glycan-related genes that were upregulated or downregulated in colon tumor tissue. N = 288 for primary tumor and N = 304 for normal tissues.

