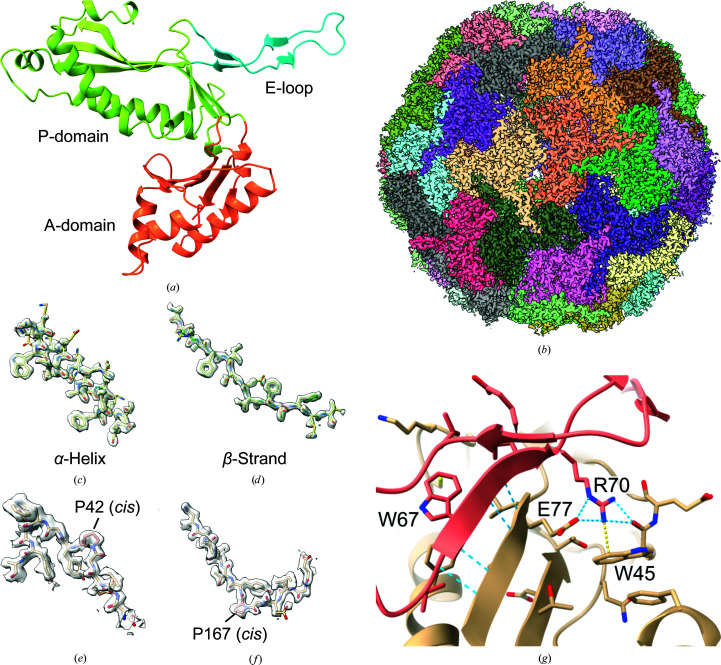
Figure 1.
Density maps and model of TmEnc. (a) Domain organization of an encapsulin monomer, as viewed from the inside of the compartment. (b) Cryo-EM density map for the entire encapsulin nanocompartment. Subunits are colored individually. (c) Representative cryo-EM density for an α-helix (residues 14–30). (d) Representative density for a β-strand (residues 241–254). (e, f) Density for two cis-prolines, which were previously not observed. (g) Intermolecular interactions between the E-loop domain (tan) and another subunit (pink). Blue dashed lines indicate hydrogen bonding, and the yellow dashed line is a cation–π interaction.

