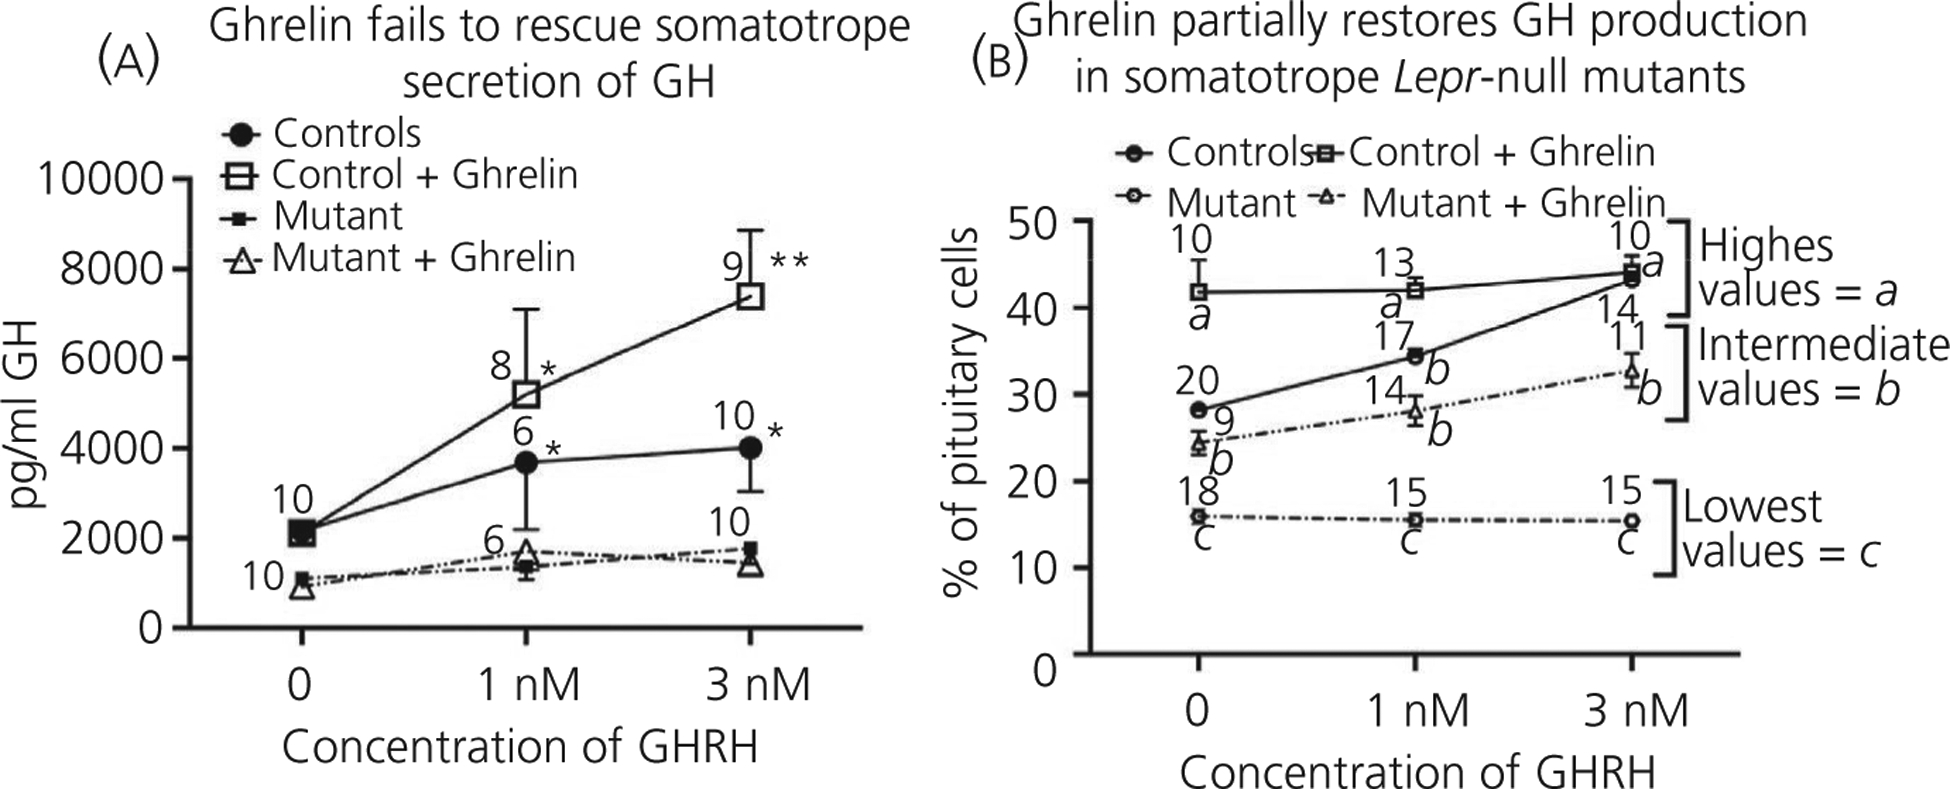
FIGURE 5.

Growth hormone (GH) responses to GH-releasing hormone (GHRH) and ghrelin in Lepr-null pituitary. A, Dispersed whole pituitary cells from adult control mice and the Lepr-null model treated with 0–3 nmol L−1 GHRH (3 hours) in the absence or presence of 10 nmol L−1 ghrelin (+ ghrelin). (B) Immunolabelled GH cells were counted in fields from the experiment shown in (A). Statistical analysis: (A) analysis by three-way ANOVA followed by Tukey’s post-hoc test. The source of variation comes from comparing control vs mutant, with all mutant responses lower than control responses, F1,85 = 2.017, P < .0001 The second source of variation comes from the different doses of GHRH, F2,85 = 4.791, P = .01. Tukey’s post-hoc test identified the following different groups (designated by asterisks): **values higher than all others; *intermediate values higher than 0 nmol L−1 GHRH. (B) Analysis by three-way ANOVA followed by Tukey’s post-hoc test. The sources of variation are the dose of GHRH, F2,157 = 19.58, P < .0001; GHRH only compared to GHRH + ghrelin, F1,157 = 158.2, P < .0001; and control vs mutant, F1,157 = 443.9, P < .0001. Additional sources of variation included GHRH only vs GHRH + ghrelin × control vs mutant, F1,157 = 11.61, P = .0008 and dose of GHRH × GHRH only vs GHRH + ghrelin × control vs mutant, F2,157 = 14.10, P < .0001. Tukey’s post-hoc test identified three groups that are significantly different from one another: a, highest values; b, intermediate values; c, lowest values. These are shown on the graph; n is indicated
