
Fig. 3.
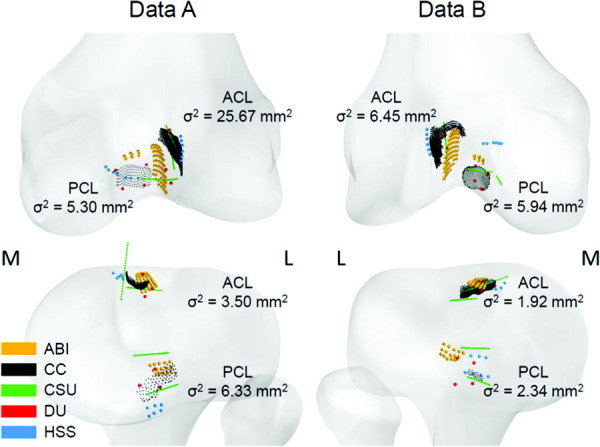
ACL and PCL attachment sites of all teams on the femur (top, posterior view) and tibia (bottom, superior/posterior view) for both data A and data B. The variance (σ2) in distance of each teams' centroid to the mean of the centroids of all teams is stated for each ligament attachment site. The medial and lateral sides are indicated by M and L, respectively.