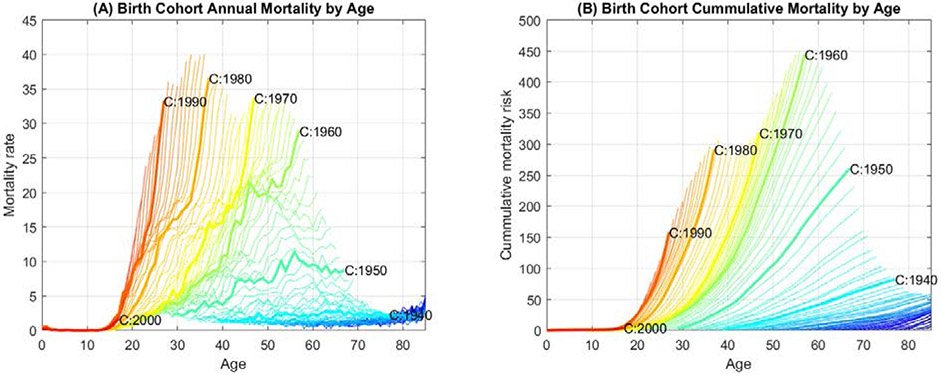
Figure 2.
Rapid rise in age-specific overdose mortality curves by birth-year cohort. (A) and (B) show the annual and the cumulative overdose mortality rates per 100,000 persons by birth-year cohorts, respectively. Each line represents a specific birth-year cohort, with the order of birth-year cohorts shown as a color spectrum, earlier cohorts to more recent cohorts represented by blue to red. Overdose mortality data from 1979-2017 are displayed. Decennial birth-year cohorts are highlighted and labeled. See Supplementary Movie 1 for the mortality rate curves for each successive cohort.

