Figure 3.
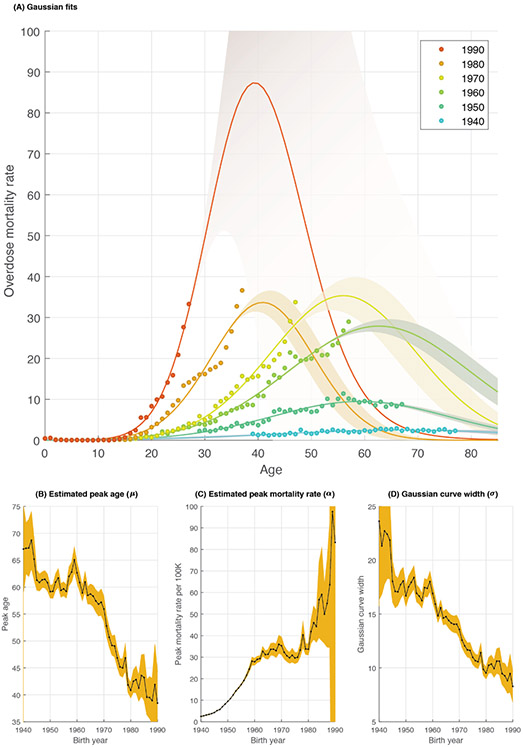
Birth-year specific overdose mortality follows Gaussian curves. (A) Observed and projected age-specific overdose mortality rate curves, showing six representative (decennial, 1940-1990) birth-year cohorts. Shown are the observed data (points) and the fitted/projected Gaussian curve approximations (solid lines with 95% confidence bounds). The order of birth-year cohorts is shown as a color spectrum, from earlier cohorts to more recent cohorts represented by blue to red. The bottom panels show the parameter estimates (black line) and 95% confidence intervals (orange colored area) for: (B) The peak age of overdose mortality (μ), (C) the peak mortality rate amplitude (α), and (D) the Gaussian curve width (σ).

