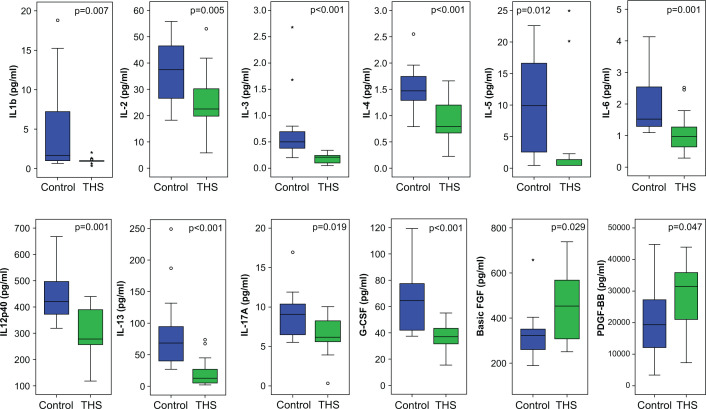
Figure 2. THS exposure affects plasma cytokine levels.
Boxplots of cytokine levels in 2-day-old mice exposed in utero to control (blue) or THS (green) (Control: n=16, one male and one female pup from 8 litters; THS: n=16; one male and one female pup from 8 litters). Box and whisker plots indicate median, 25th and 75th percentiles, 5th and 95th percentiles, and individual samples beyond these limits. Nominal P-values shown were obtained using the Mann–Whitney test. Outliers are cases with values beyond 1.5 times (°) and 3 times (*) the interquartile range. See also Supplementary Table S1 for FDR values.

