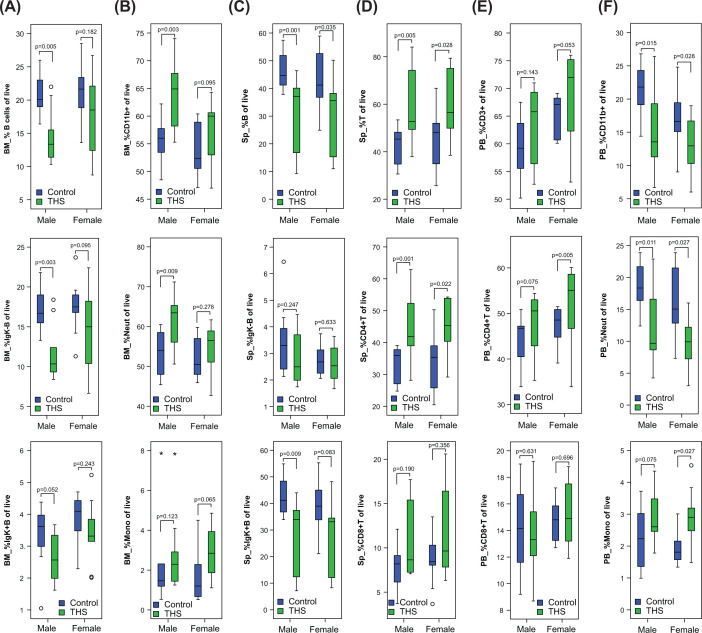
Figure 4. Sex-specific effects of THS on immune cell populations.
For immune cell populations identified in Figure 3 as divergent between control and THS-exposed mice, males and females, as well as immune subsets, were compared as described in the legend to Figure 3. (A) BM B cells (B220+/CD19+), mature B cells (B220+/CD19+/IgK+) and immature B cells (B220+/CD19+/IgK−). (B) BM myeloid cells (CD19−/CD11b+), monocytes (CD19−/CD11b+/Gr-1neg-lo) and neutrophils (CD19−/CD11b+/Gr-1mod-hi). (C) SP B cells (B220+/CD19+), mature B cells (B220+/CD19+/IgK+) and immature B cells (B220+/CD19+/IgK−). (D) SP T cells (CD3+), T-helper cells (CD3+/CD4+) and T-suppressor cells (CD3+/CD8+). (E) PB T cells (CD3+), T-helper cells (CD3+/CD4+) and T-suppressor cells (CD3+/CD8+). (F) PB myeloid cells (CD19−/CD11b+), monocytes (CD19−/CD11b+/Gr-1neg-lo) and neutrophils (CD19−/CD11b+/Gr-1mod-hi). Outliers are cases with values beyond 1.5 times (°) and 3 times (*) the interquartile range.

