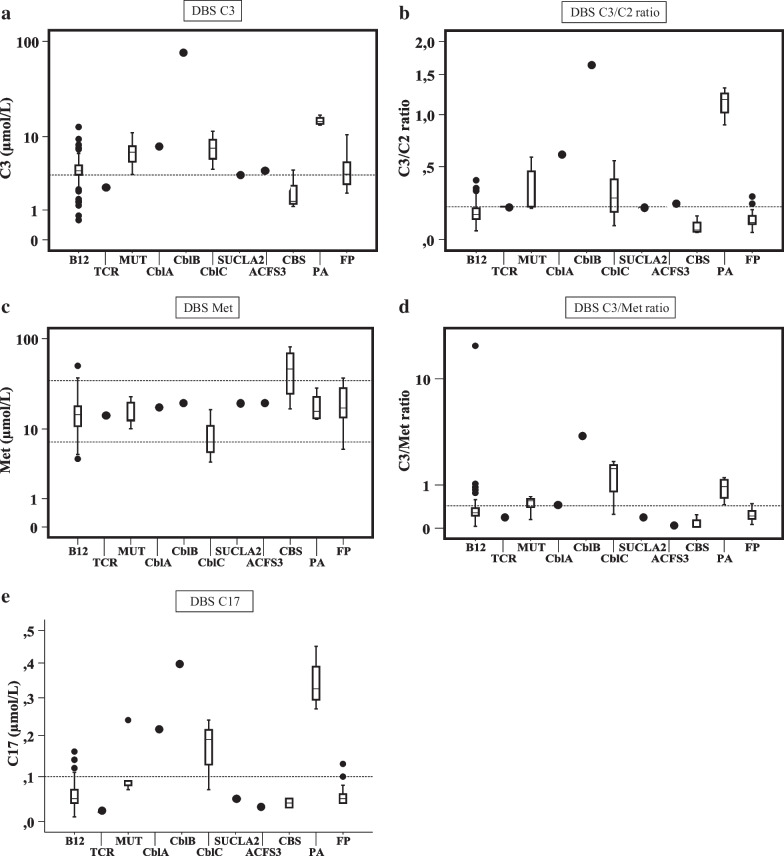
Fig. 3.
Altered values of primary markers on dried blood spots on selected newborns. Y-axis is represented in logarithmic scale. Values are depicted as box-and-whisker plots with minimum and maximum. Dashed lines represents the cut-off values in μmol/L: C3: initial strategy: > 4.5 (99th ptl); current strategy: > 3.5 (96th ptl); Met: 7–35 (1th ptl and 99.7th ptl, respectively); C17: > 0.1 (99.9th ptl); C3/C2 ratio: > 0.2 (99.8th ptl); C3/Met ratio: > 0.43 (99.8th ptl). Ptl: percentile. ACSF3 combined malonic and methylmalonic acidemia due to acyl-CoA synthetase family, member 3 deficiency, B12 vitamin B12 deficient newborns, CblA methylmalonic acidemia CblA type, CblB methylmalonic acidemia CblB type, CblC methylmalonic acidemia with homocystinuria CblC type, CBS cystathionine β-synthase deficiency, C17 heptadecanoilcarnitine, C2 acetylcarnitine, C3 propionylcarnitine, FP false positive, Met methionine, MUT methylmalonyl-CoA mutase deficiency, PA propionic acidemia, SUCLA2 beta-subunit of the ADP-forming succinyl-CoA synthetase deficiency, TCR transcobalamin receptor defect

