Fig. 3.
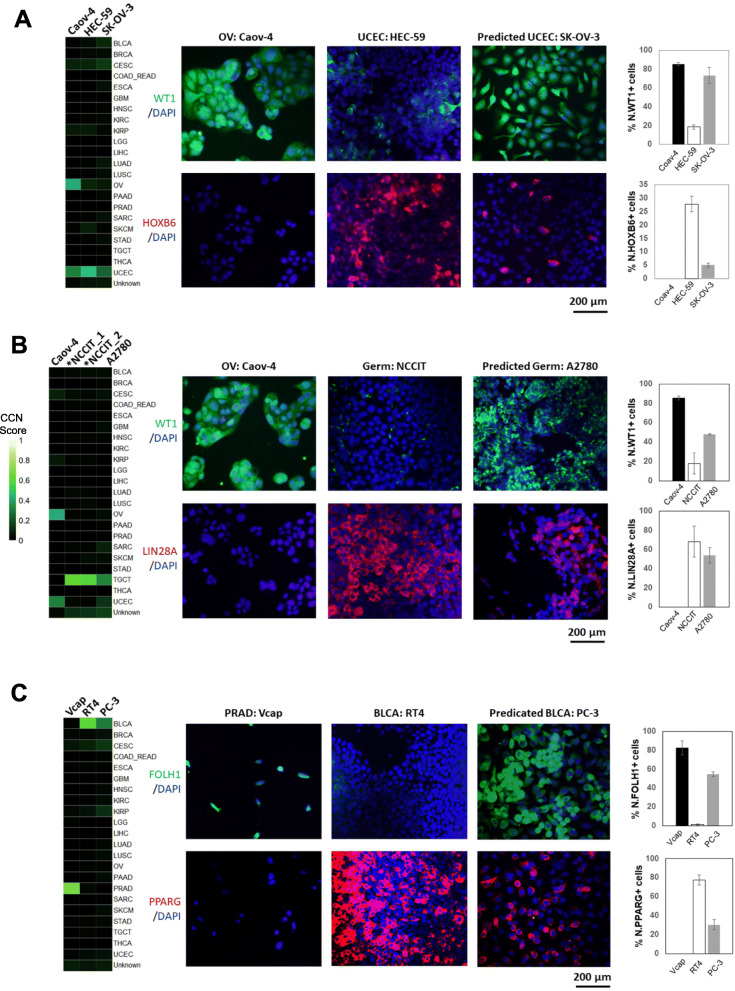
Immunofluorescence of selected cell lines. a Classification profiles (left) and IF expression (middle) of Caov-4 (OV-positive control), HEC-59 (UCEC-positive control), and SK-OV-3 for WT1 (OV biomarker) and HOXB6 (uterine biomarker). The rightmost bar plots quantify the average percentage of positive cells for WT1 (top-right) and HOXB6 (bottom-right). b Classification profiles (left) and IF expression (middle) of Caov-4, NCCIT (germ cell tumor-positive control), and A2780 for WT1 and LIN28A (germ cell tumor biomarker). Classification was performed on replicates of NCCIT RNA-seq profiles. The rightmost bar plots quantify the average percentage of positive cells for WT1 (top-right) and LIN28A (bottom-right). c Classification profiles (left) and IF expression (middle) of Vcap (PRAD positive control), RT4 (BLCA-positive control), and PC-3 for FOLH1 (prostate biomarker) and PPARG (urothelial biomarker). The rightmost bar plots quantify the average percentage of positive cells for FOLH1 (top-right) and PPARG (bottom-right)

