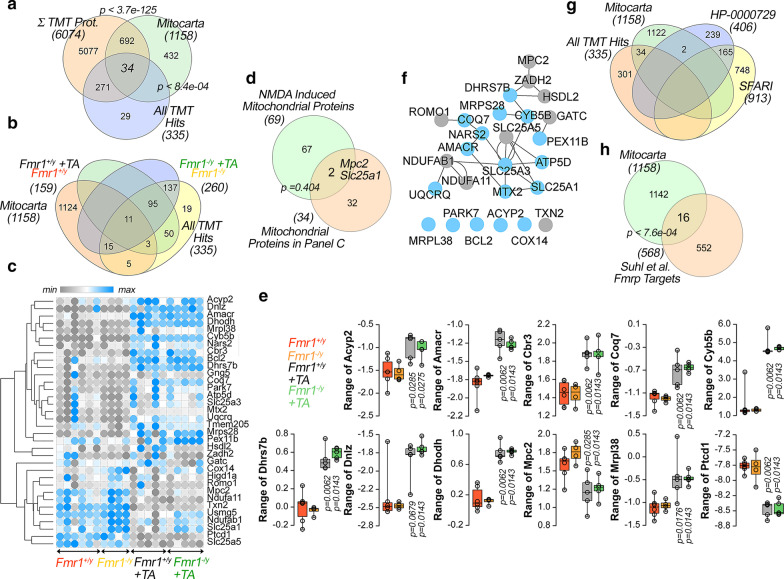
Fig. 4.
The mitoproteome sensitive to activity deprivation and Fmr1−/y. a Venn diagram comparing all Mitocarta 2.0 entries with all TMT quantified proteins (6074), all hits sensitive to TTX-APV plus those sensitive to the Fmr1−/y genotype (335). b Venn diagram comparing all Mitocarta 2.0 mitoproteome with protein hits sensitive to TTX-APV in wild type cells (159) or Fmr1−/y cells (260) and all TMT proteome hits (335). c Hierarchical clustering analysis of the expression of 34 proteins in wild type and Fmr1−/y cells treated with vehicle or TTX-APV. Kendal Tau clustering analysis of rows. d Venn diagram comparing the 34 mitochondrial proteins listed in c and those puromycinylated after NMDA treatment of synaptosomes [39]. e Normalized TMT Log2 expression of top mitochondrial hits. Kruskal–Wallis Test followed by Mann–Whitney U Test. n = 6 wild type and n = 4 Fmr1−/y for vehicle treated cultures, n = 5 for each genotype treated with TTX-APV TTX-APV-treated. f Interactome of the TTX-APV and Fmr1−/y sensitive mitoproteomes. Blue nodes represent upregulated proteins. Grey represent downregulated proteins. g Venn diagram of all TMT hits, the Mitocarta 2.0 dataset and two autism spectrum disorder curated gene sets. h Venn diagram of Mitocarta 2.0 dataset and the Suhl et al. curated Fmrp targets

