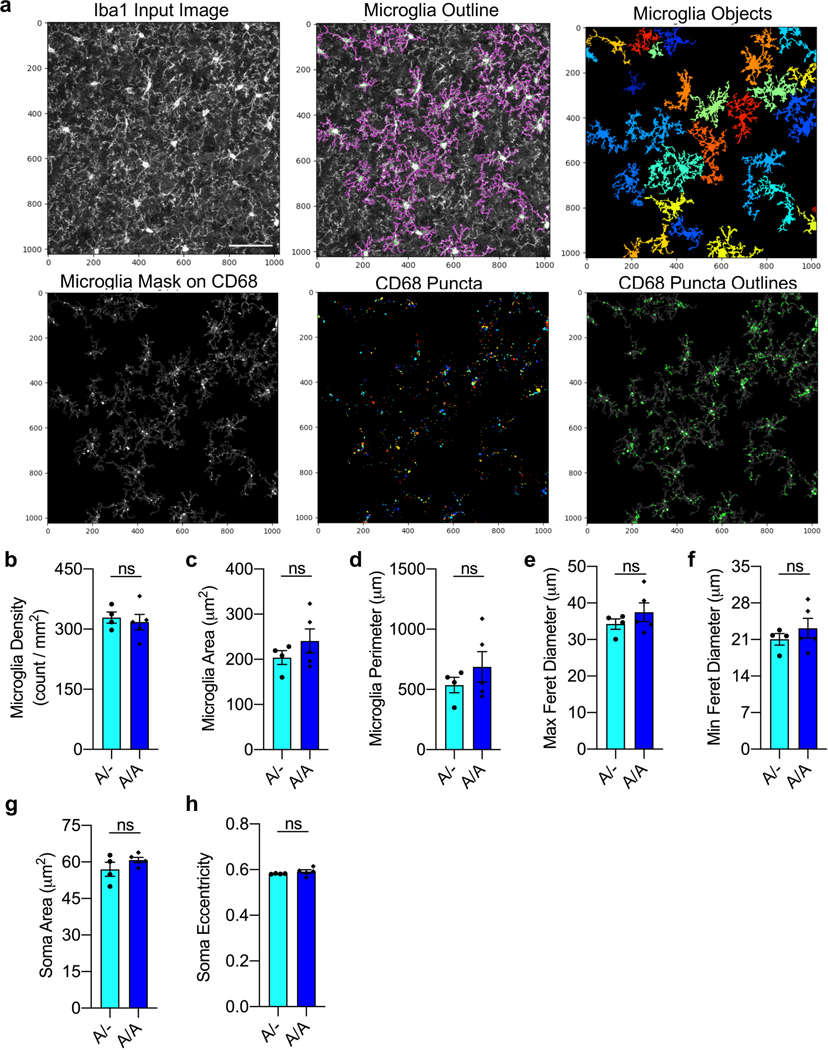
Extended Data Fig. 7 |. Cell Profiler microglia morphological analysis.
a, Cell Profiler software was used to analyze microglia morphology and lysosomal activity in the frontal cortex of P40 hC4A/- and hC4A/A mice. Microglial soma and processes are identified by Iba1 signature by using the image-based watershed method (top row). Microglia are used as a mask to select and quantify intracellular CD68 puncta (bottom row; scale = 50 μm). b-h, Morphological parameters for mPFC microglia (b-f) and their soma (g-h) from hC4A/- (n = 4) and hC4A/A (n = 5) mice were calculated by Cell Profiler software at P40 timepoint (ns = P > 0.05, two-tailed Mann-Whitney test). Bar graphs show mean ± s.e.m.

