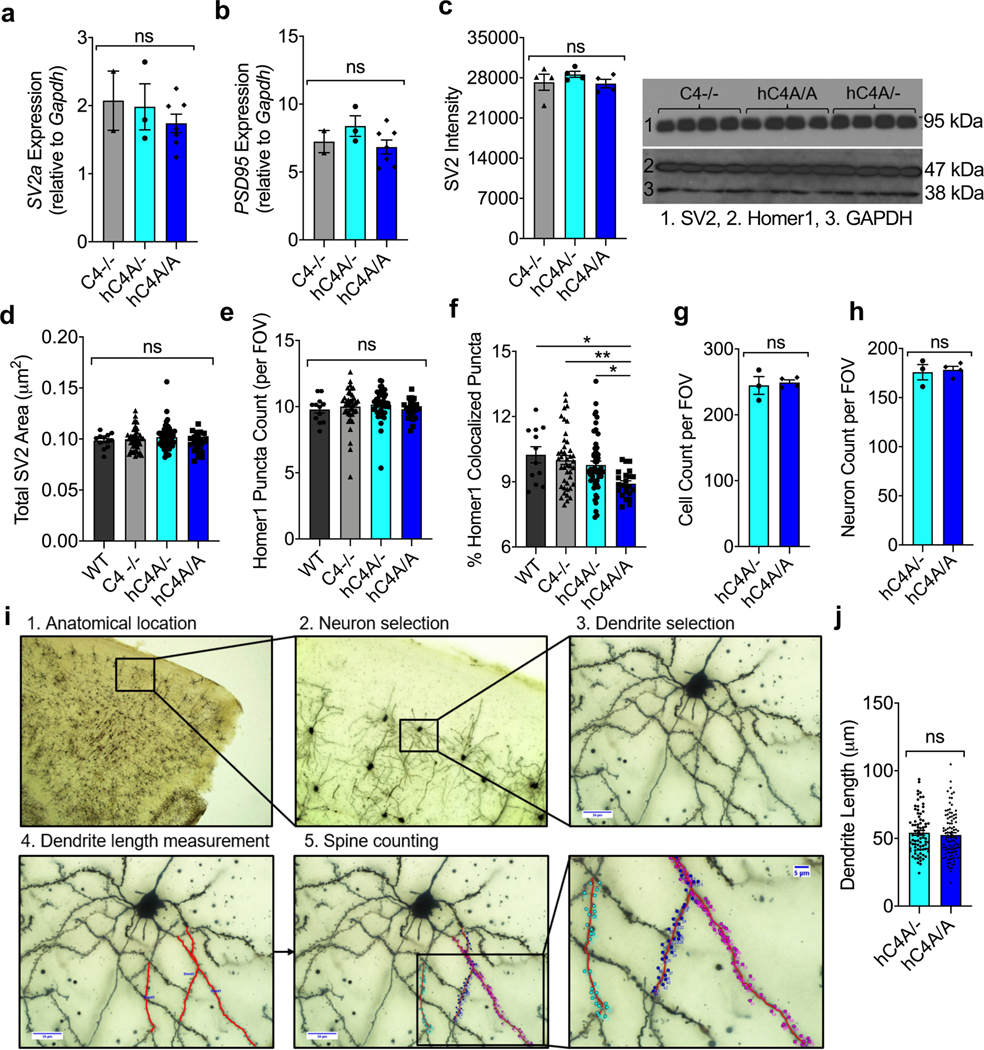
Extended Data Fig. 9 |. Synaptic protein expression is not affected by C4A overexpression in mice.
a-b, rt-PCR was used to measure mRNA expression of Sv2a (a) and Psd95 (b) in the FC in adult mice (C4−/− n = 2, hC4A/- n = 3, and hC4A/A littermates n = 7). RNA expression was normalized to Gapdh expression. c, SV2 and PSD95 protein level were analyzed by western blot. GAPDH was used as a loading control protein (C4−/− n = 4, hC4A/- n = 4, and hC4A/A n = 4 littermates from one experiment; Kruskal-Wallis test with Dunn’s multiple comparisons test; ns = P > 0.05). Unprocessed versions of the western blots can be found in Supplementary Figure 1b. d, Total SV2 area per FOV in the mPFC was calculated from immunofluorescence staining between WT (n = 3), C4−/− (n = 11), hC4A/- (n = 13), and hC4A/A (n = 6) groups (Kruskal-Wallis test with Dunn’s multiple comparisons test). e-f, Total Homer1 puncta and percentage of colocalized Homer1 puncta from the mPFC in adult mice were calculated for WT (n = 3), C4−/− (n = 11), hC4A/- (n = 13), and hC4A/A (n = 6) groups (Kruskal-Wallis test with Dunn’s multiple comparisons test; ns = P > 0.05, * PWT vs A/A = 0.0139, ** PWT vs A/A = 0.0139). g-h, Brain sections were stained with DAPI and NeuN, and cellularity was measured in frontal cortex at P180. Total cells (g) and neurons (h) per FOV in frontal cortex is represented for hC4A/- (n = 3) and hC4A/A mice (n = 4; two-tailed Mann-Whitney test; ns = P > 0.05). i, Method used for the manual counting of dendritic spines in mPFC of hC4 mice. j, Length of dendrites that have been used for spine density analysis for hC4A/- (80 dendrites) and hC4A/A (96 dendrites; two-tailed Mann-Whitney test; ns = P > 0.05). Bar graphs show mean ± s.e.m.

