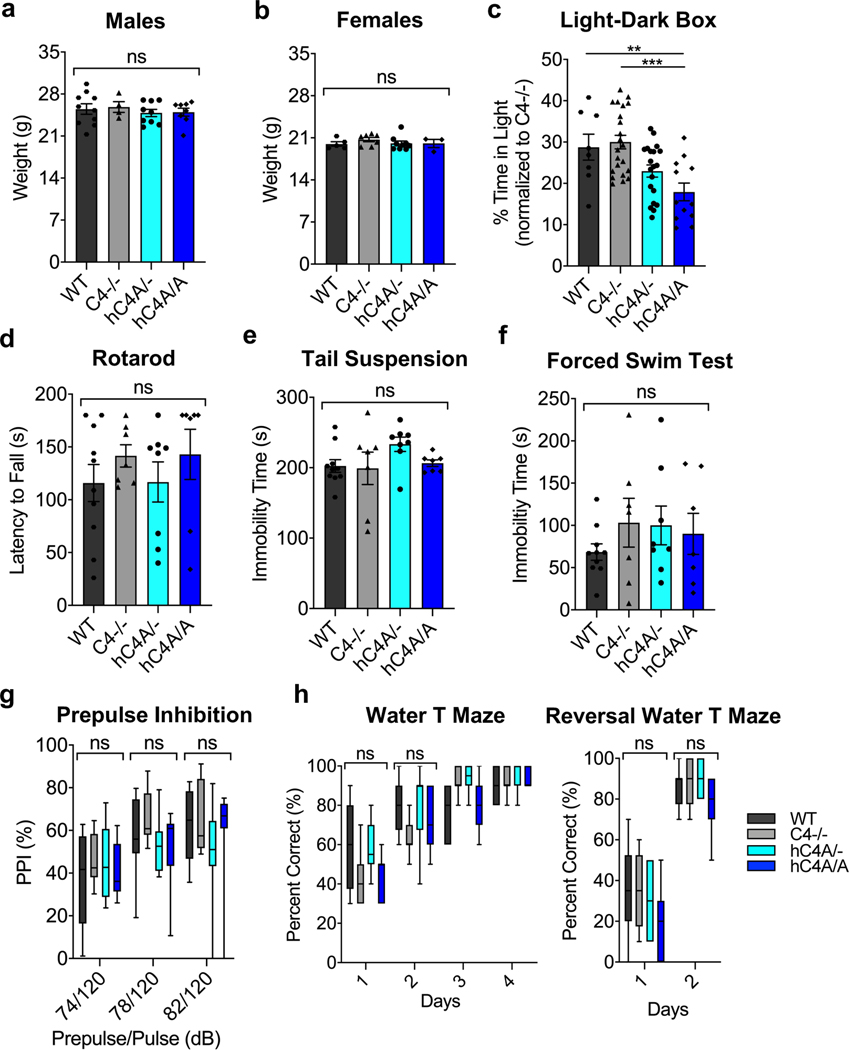
Extended Data Fig. 10 |. Human-C4A overexpression alters mouse behavior.
a-h, WT, C4−/−, hC4A/-, and hC4A/A mice were subjected to a battery of behavioral tests. a-b, Weight of male and female mice were compared between WT (n = 10), C4−/− (n = 4), hC4A/- (n = 9), and hC4A/A mice (n = 8; Kruskal-Wallis test with Dunn’s multiple comparisons test; ns = P > 0.05). c, Anxiety levels were measured in the light-dark box test by time spent in the light-zone between WT (n = 8), C4−/− (n = 22), hC4A/- (n = 20), and hC4A/A (n = 12) groups (two-tailed, unpaired t test; ** P = 0.0085; two-tailed Mann-Whitney test, *** P = 0.0009). Results were normalized to the C4−/− group to retain littermate controls. d, In the rotarod test, latency to fall was measured in seconds for WT (n = 10), C4−/− (n = 7), hC4A/- (n = 8), and hC4A/A (n = 7) groups (Kruskal-Wallis test with Dunn’s multiple comparisons test, ns = P > 0.05). e-f, Immobility time in seconds was compared in the tail suspension test (e) and the forced swim test (f) for WT (n = 10), C4−/− (n = 7), hC4A/- (n = 8), and hC4A/A (n = 7) groups (Kruskal-Wallis test with Dunn’s multiple comparisons test, ns = P > 0.05). g, Prepulse inhibition was measured between WT (n = 10), C4−/− (n = 7), hC4A/- (n = 8), and hC4A/A (n = 7) groups (two-way ANOVA with Tukey’s multiple comparisons test; ns = P > 0.05). h, Percent of correct decisions were recorded in the water t maze and the reversal water t maze for WT (n = 10), C4−/− (n = 7), hC4A/- (n = 8), and hC4A/A (n = 7) groups (two-way ANOVA with Tukey’s multiple comparisons test; ns = P > 0.05). Bar graphs show mean ± s.e.m. Box-and-whisker plots display the median (center line), 25th to 75th percentile (box), and minimum to maximum values (whiskers).

