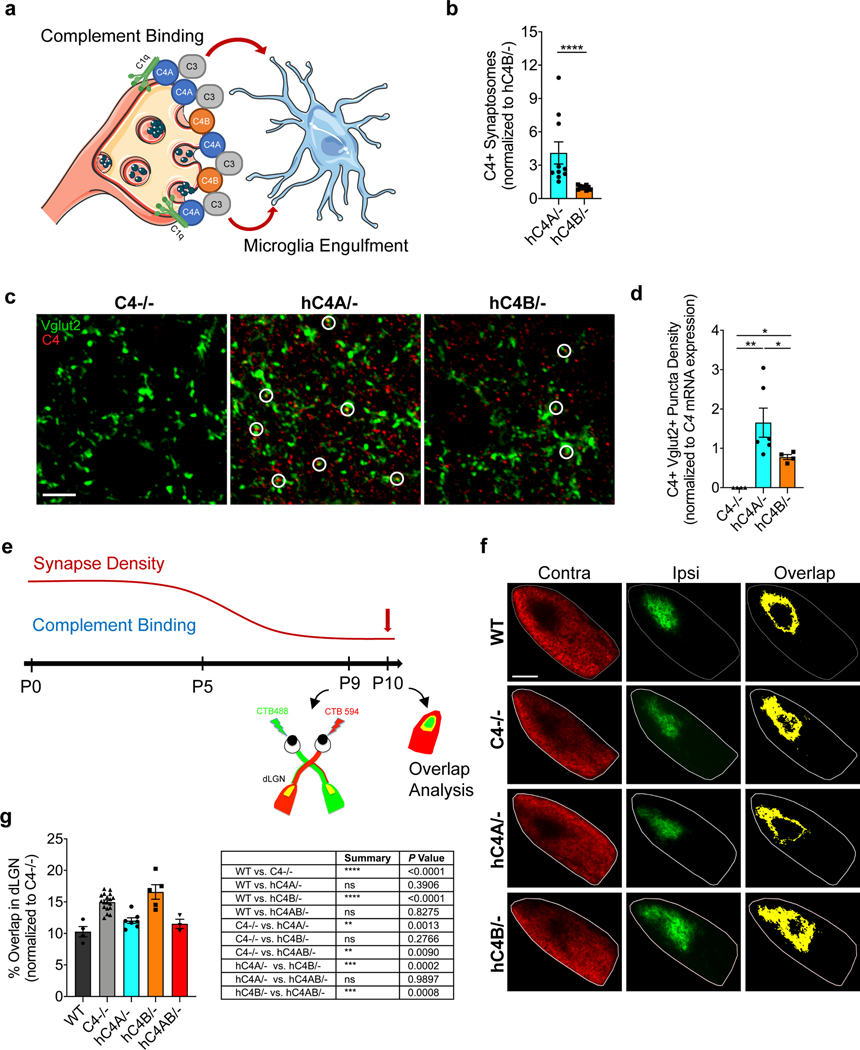
Fig. 2 |. Human C4A is more efficient than C4B in synaptic pruning.
a, At the synapse, complement-dependent pruning is carried out by the classical complement cascade. After C1q tagging, C4 binds the synapse and C3 is then activated for microglia recognition by the receptor CR3. Microglia engulf the complement-bound synapses for refinement. b, Synaptosomes from C4−/− mice were isolated and incubated with serum containing the same amount of C4 from hC4A/− (n = 10) or hC4B/− (n = 9) mice. C4 deposition on synaptosomes was detected and quantified by flow cytometry (serum from three independent experiments; Mann–Whitney test, two-tailed, ****P < 0.0001). c,d, C4 deposition onto Vglut2+ synaptic terminals in the dLGN was identified by immunofluorescence staining at P5 in C4−/− (n = 4), hC4A/− (n = 6) and hC4B/− (n = 4) mice. c, Representative images of C4 (red) and Vglut2 (green) staining in the dLGN showing C4+Vglut2+ synapses (white circles). Scale bar, 5 μm. d, Quantification of C4+Vglut2+ synapse density in P5 hC4 transgenic mice (three independent experiments; results were normalized to hC4 mRNA expression in the LGN (Mann–Whitney test, two tailed: **PC4−/− vs hC4A/− = 0.0095, *PC4−/− vs hC4B/− = 0.0286, *PhC4A/− vs hC4B/− = 0.0190). e, To investigate complement-dependent synaptic pruning in the retinogeniculate system, the eye-specific segregation assay was performed. Mice were injected with fluorescently tagged CTB (CTB-488 and CTB-594) in each eye at P9 and brains were collected at P10. f, Representative images of WT, C4−/−, hC4A/− and hC4B/− mice at P10 are shown. Inputs from contralateral (Contra; red) and ipsilateral (Ipsi; green) eyes and overlapping area (yellow) are shown. Scale bar, 100 μm. g, The percentage overlap of the contralateral and ipsilateral areas were calculated for P10 WT (n = 4), C4−/− (n = 18), hC4A/− (n = 7), hC4B/− (n = 6) and hC4AB/− (n = 3) mice (2 independent experiments; all results were normalized to the C4−/− group to retain littermate controls; one-way ANOVA with Tukey’s multiple comparisons test). Bar graphs show the mean ± s.e.m.

