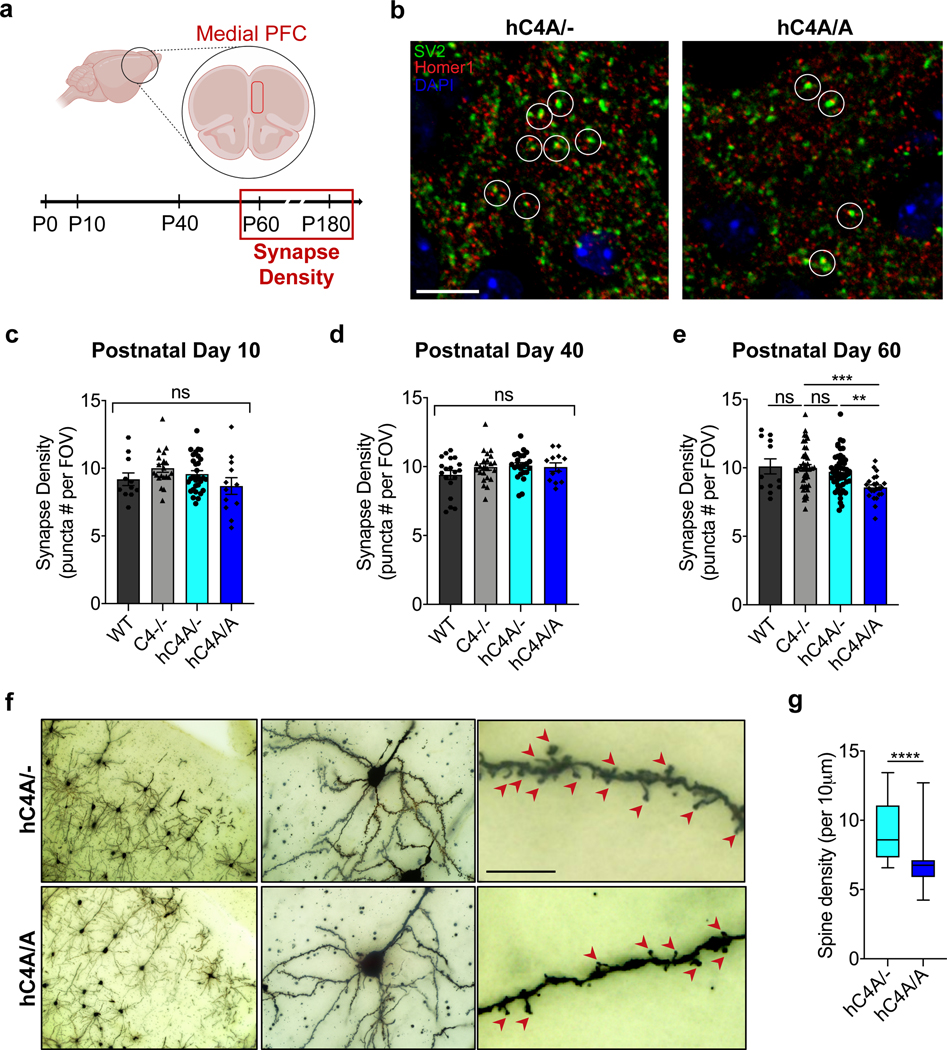
Fig. 5 |. Adult hC4A-overexpressing mice have decreased synapse density in the mPFC.
a, Schematic of the experiment. The extent of synaptic pruning in the mPFC was evaluated by synapse-density quantification at different time points (P10, P40, P60 and P180). b, Synapses are defined as SV2+ and Homer-1+ colocalized puncta (indicated by white circles) in P60 hC4A/− and hC4A/A mice. Scale bar, 10 μm. c–e, Synapse-density quantification by immunofluorescence in the mPFC at P10 (c), P40 (d) and P60 (e) mice showed a reduction in hC4A/A mice only at the P60 time point. All results were normalized to the C4−/− group to retain littermate controls. c, Synapse density in the mPFC of P10 WT (n = 3), C4−/− (n = 5), hC4A/− (n = 8) and hC4A/A (n = 3) mice was quantified (3–4 FOVs per mouse; 4 independent cohorts; Kruskal–Wallis test with Dunn’s multiple comparisons test). d, Synapse density in the mPFC of P40 WT (n = 3), C4−/− (n = 6), hC4A/− (n = 6) and hC4A/A (n = 3) mice was quantified (3–4 FOVs per mouse; 4 independent cohorts; ordinary one-way ANOVA with Tukey’s multiple comparisons test). e, Synapse density in the mPFC of P60 WT (n = 3), C4−/− (n = 11), hC4A/− (n = 13) and hC4A/A (n = 6) mice was quantified (3–4 FOVs per mouse; 5 independent cohorts; Kruskal–Wallis test with Dunn’s multiple comparisons test, ***P = 0.0007, **P = 0.0039). f, Golgi staining was used to identify pyramidal neurons in the mPFC (left and middle), and high-magnification imaging revealed dendritic spines (right; red arrowheads) in P180 hC4A/− and hC4A/A mice. Scale bar, 10 μm. g, The spine density for each neuron is represented (5–6 neurons per mouse from 5 hC4A/− and 5 hC4A/A littermates from 2 independent cohorts; Mann–Whitney test, two-tailed, ****P < 0.0001). Bar graphs show the mean ± s.e.m. Box-and-whisker plots display the median (center line), the 25th to 75th percentile (box), and minimum to maximum values (whiskers).

