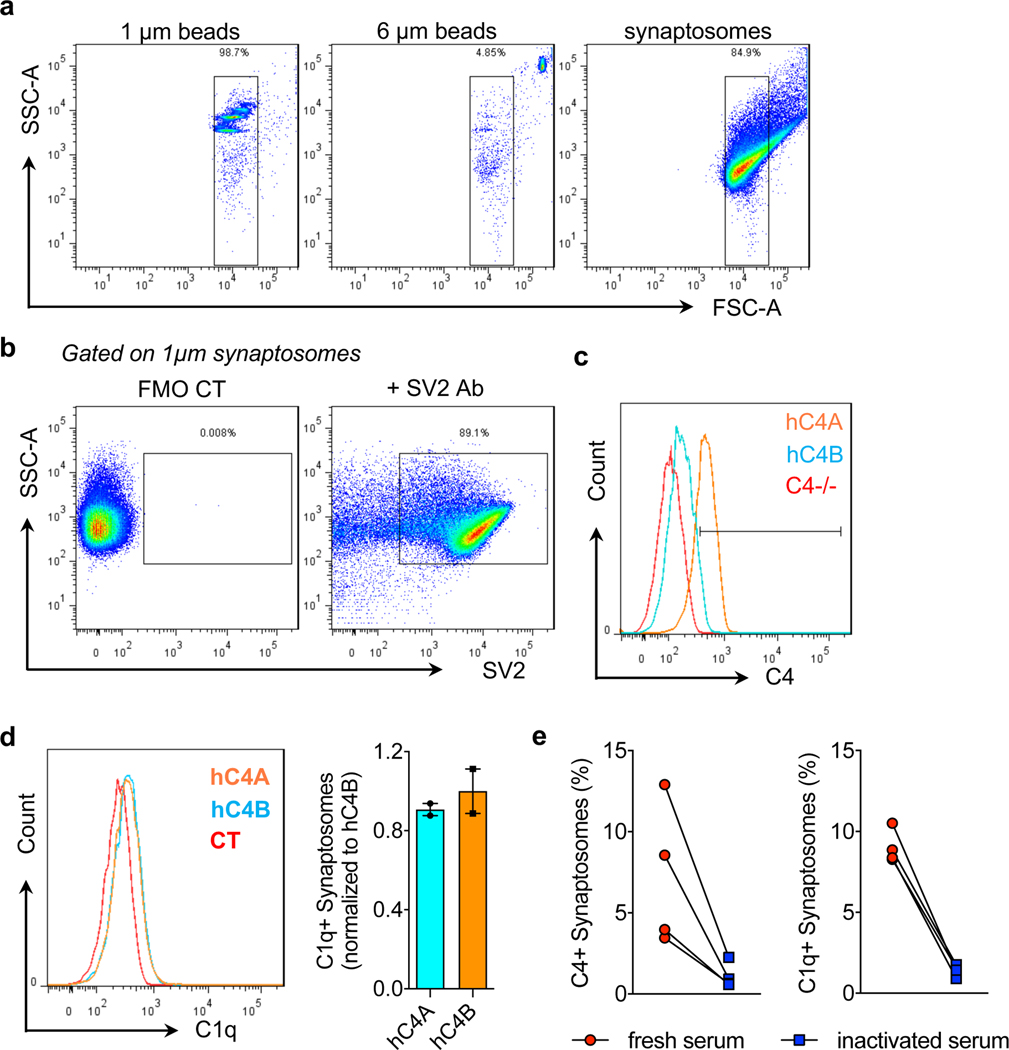
Extended Data Fig. 3 |. Complement activation and binding to synaptosomes.
a, Representative dot plots showing the FSC-A / SSC-A of 1-μm beads, 6-μm beads, and synaptosomes. Further analysis will be gated on 1-μm synaptosomes. b, Synaptosomes were permeabilized and stained with anti-SV2 antibody (+ SV2 Ab) or no antibody (FMO CT). More than 85% of the particles analyzed contain SV2 protein. c, Representative histogram plot of C4 staining on synaptosomes isolated from C4−/− mice and incubated with serum from C4−/− (red), hC4A (orange), and hC4B (blue) mice. d, C1q deposition is shown and quantified using serum from hC4A mice (orange; n = 2), hC4B mice (blue; n = 2), or no serum CT (red). e, C4 (left) and C1q (right) deposition was detected on synaptosomes using fresh (red) or heat-inactivated (blue) serum. Bar graph shows mean ± s.e.m.

