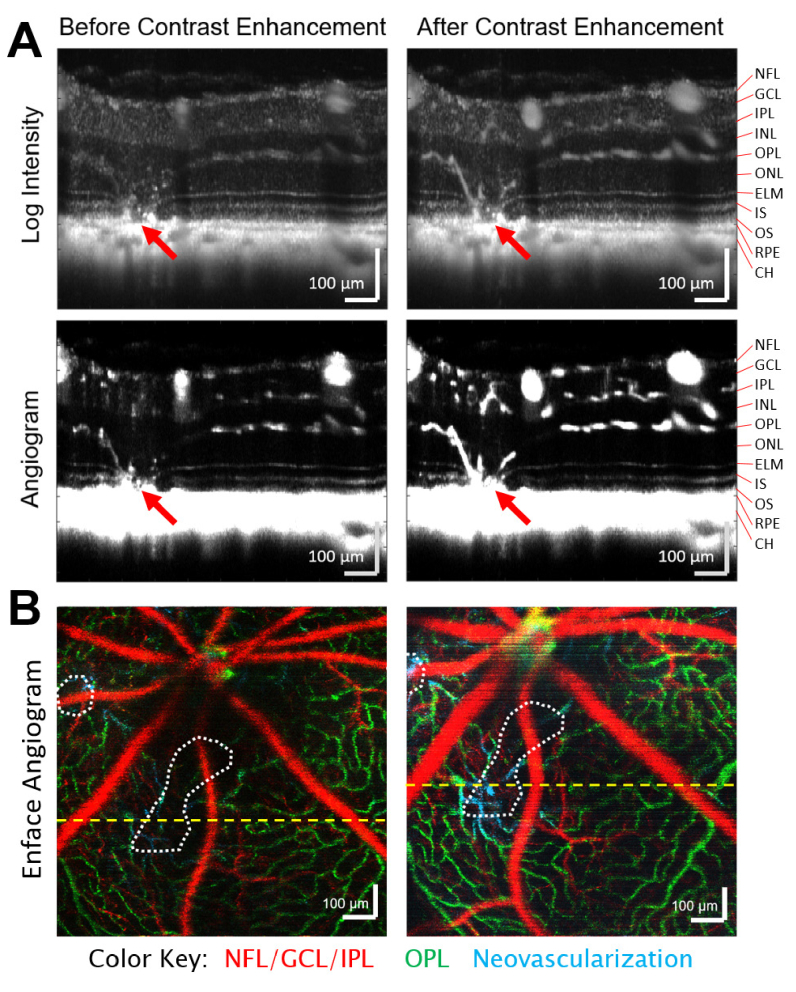
Fig. 1.
Volumetric OCT scans provide depth-resolved structural and angiographic information, which can be enhanced with an injectable tracer. A) Intravenous injection of Intralipid 20% as an OCT contrast agent dramatically improves the OCT intensity and angiogram signals within both healthy vasculature and neovascularizations (red arrows). Log intensity and angiogram images are shown both before and during peak enhancement of the injection with 100 averages from a single dynamic-contrast OCT scan. These pairs of intensity and angiogram images are shown with the same dynamic range. B) Color-coded enface angiograms from pre- and post-injection volumetric OCT angiography scans are segmented by depth and maximum intensity projected to highlight the vasculature of the superficial (red), and deeper (green) vascular layers. Neovascularizations that inhabit typically avascular layers are shown in cyan and the bounds of lesions are denoted by dotted white lines. The locations of the above cross-sectional scans are given by the yellow dashed lines. NFL – Nerve Fiber Layer, GCL – Ganglion Cell Layer, IPL – Inner Plexiform Layer, INL – Inner Nuclear Layer, OPL – Outer Plexiform Layer, ONL – Outer Nuclear Layer, ELM – External Limiting Membrane, IS – Inner Segments, OS – Outer Segments, RPE – Retinal Pigment Epithelium, CH – Choroid.

