Fig. 2.
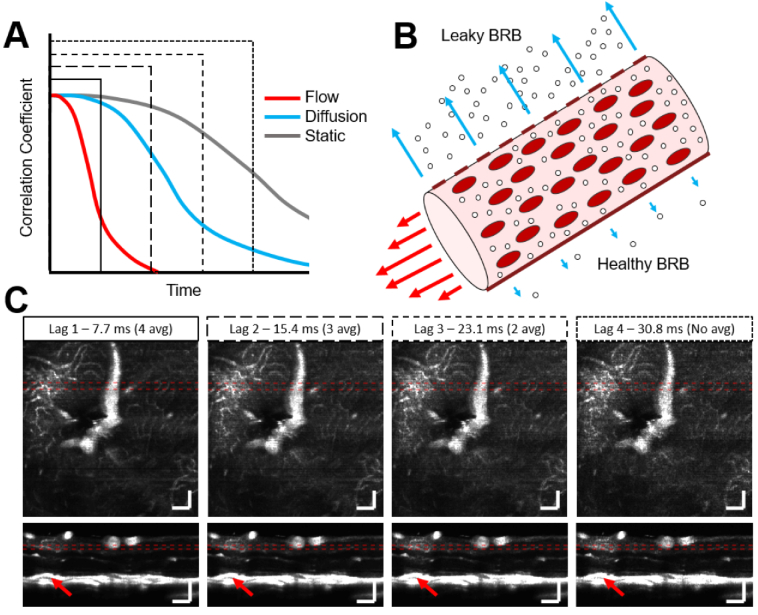
Selecting a longer angiogram interscan time increases the sensitivity to signals that decorrelate more slowly. A) In most cases, intravascular flow signals (red) will decorrelate most quickly due to the high speed of tracer particles and red blood cells through the field of view. Diffusion (cyan) is typically slower than flow and signals will therefore decorrelate more slowly. OCT signals in static tissue (grey) decorrelate the slowest. The four line styles represent four different interscan, or lag, times used in ExCEL-OCT processing and shown in C) below. B) Impairment of the blood retinal barrier (BRB) is expected to allow more tracer particles to extravasate relative to a healthy BRB. C) As interscan time is increased, the resulting angiograms become more sensitive to slower decorrelation rates, as can be seen above a retinal lesion (red arrow). This region can be seen in more detail in Fig. S1. Mean intensity projections through a leakage hotspot are shown over 40 µm laterally or 20 µm axially as denoted by the dotted red lines in the enface and B-scan images. Scale bars are 100 µm and all figures are shown with the same dynamic range.

